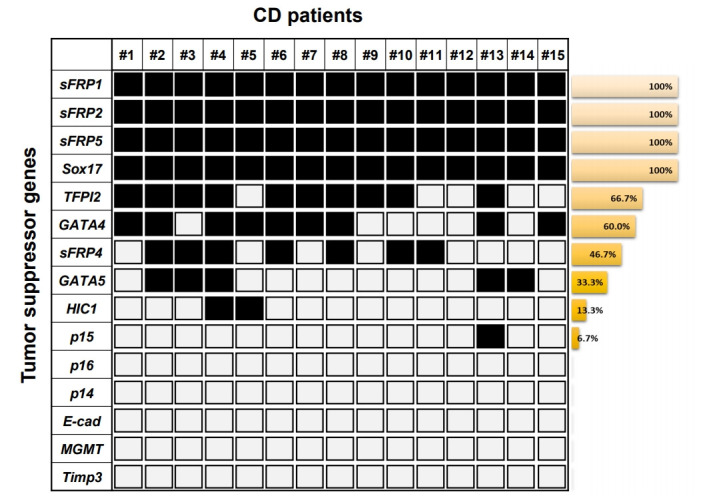
Fig. 1.

Summarized results from the methylation analyses on the tumor suppressor genes identified from colon cancer and obtained from patients with CD. Each square and number indicates a single CD patient blood sample. The white square indicates the unmethylated CpG sites. The black square indicates the methylated CpG sites. The Bar graph presents methylation frequencies of tested genes. E-cad, Ecadherin.
