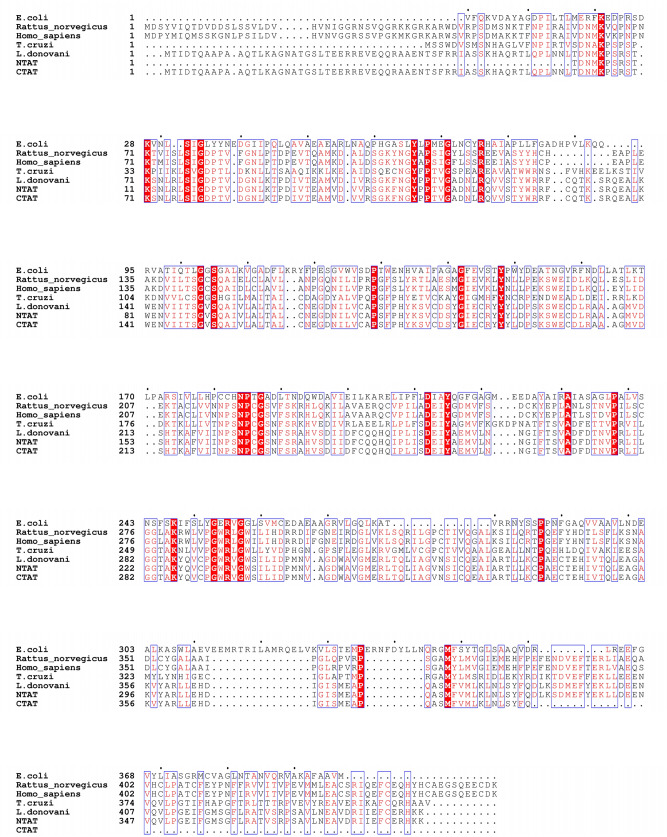
Figure 2.
Multiple Sequence alignment analysis: The figure shows the sequence alignment of tyrosine aminotransferase of L. donovani with E. coli (18.66% identity), Rattus norvegicus (35.70% identity), Homo sapiens (35.01% identity) and T. cruzi (43.66% identity). It is observed that the N-terminal of TAT from L. donovani has a very little identity with other TAT sequences but the C-terminal shows a large number of identical sequences conserved across the organisms. The red highlighted boxes with residues in white font depict identical and conserved amino acid residues whereas the blue boxes that are non-highlighted represent similar amino acid residues in red font.

