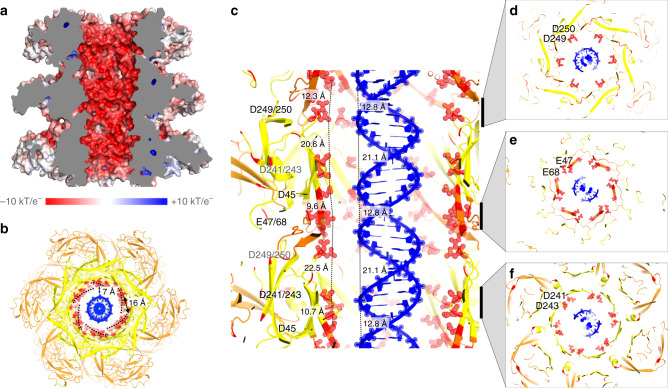
Fig. 7. Acidic motifs in the tail tube in the context of translocating DNA.
Cut-away views of the tail tube with a double-stranded DNA segment represented at scale within the transit corridor. a The surface electrostatic potential is represented on the molecular surface as a red–blue gradient from electronegative to electropositive. b–f DNA is shown in blue and the tail tube domains 1 and 2 in yellow and orange, respectively. Acidic residues lining the inner surface of the tail tube are shown as red spheres and labelled. In d–f longitudinal sections of the tail viewed from the phage head highlight the presence of dyads of acidic residues. Supplementary Movie 1 and Supplementary Fig. 9 provide more details.

