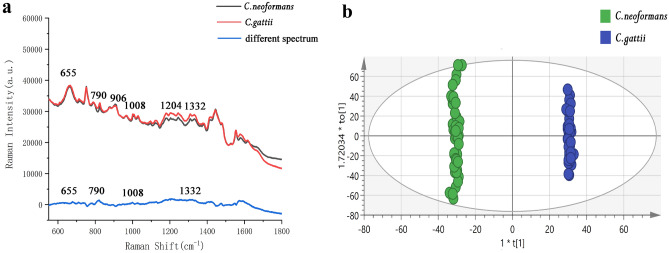
Figure 5.
Distinguishing C. neoformans and C. gattii. (a) Surface-enhanced Raman scattering spectrum of C. neoformans and C. gattii and difference spectrum. Their peaks have differences at 655 cm−1, 790 cm−1, 1,008 cm−1, and 1,332 cm−1. The peak bands at 655 cm−1 are assigned to Guanine and tyrosine, the peak located at 790 cm−1 is assigned to Cytosine and uracil, the peak located at 1,008 cm−1 is assigned to Phenylalanine, galactomannan and C–C aromatic ring stretching, and the peak located at 1,332 cm−1 is assigned to Adenine, guanine and CH deformation. (b) Orthogonal partial least-squares discriminant analysis of C. neoformans and C. gattii via SERS spectra, where each point represents a sample. The data points are well separated on both sides of the central axis. There is no intersection and they are concentrated on both sides.

