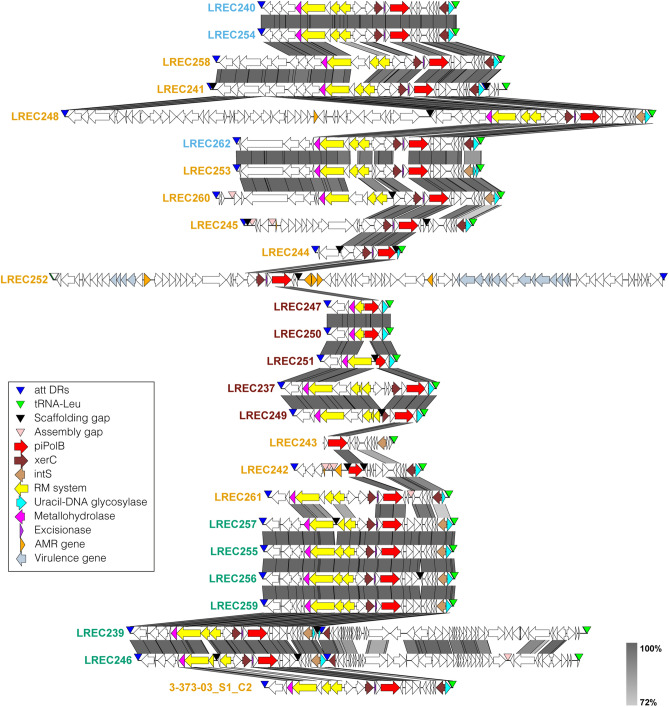
Figure 2.
Genetic structure of new pipolins from LREC collection. Predicted protein-coding genes are represented by arrows, indicating the direction of transcription and colored following Prokka annotation as indicated in the legend. The greyscale on the right reflects the percent of amino acid identity between pairs of sequences. The image was generated by EasyFig software and re-annotated pipolins sorted according to the hierarchical clustering of the gene presence/absence matrix. Names of pipolin carrying strains are colored according to phylogroups as in Fig. 1.

