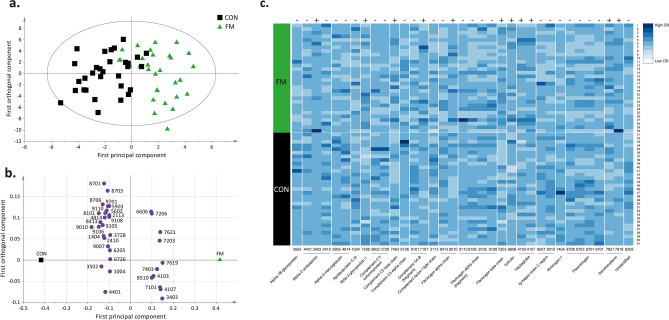
Figure 1.
Differences in plasma proteins between FM and CON using OPLS-DA modeling. (a) Score plot showing the separation between the FM and CON group. (b) Loading plot displaying proteoforms with VIP > 1. Numbers in the loading plot refers to equal spot numbers in (c), Table 2 and in supplementary Figure S1 and Table S1. (c) Heatmap showing individual (from each participant) optical density (OD) of quantified proteins for each proteoform with a VIP > 1 between FM and CON. The darker the color intensity, the higher OD of the proteoform (see color key). The loading and score plots were created in SIMCA P + (version 15), and the heatmap was created in R using the gplots package74. +, upregulated in FM compared to CON; —, downregulated in FM compared to CON.

