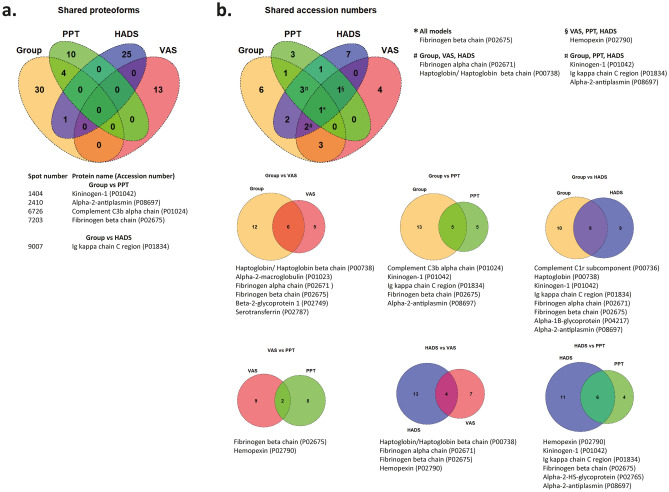
Figure 9.
Venn diagram of shared proteoforms and proteins. (a) Venn diagram showing shared proteoforms between all models. Group group differences FM and CON, PPT PPT in FM, HADS Psychological distress in FM, VAS pain intensity in FM. Numbers prior protein name refer to unique spot numbers, while UniProt accession number for each protein is indicated in parenthesis. (b) Upper Venn diagram shows shared proteins between all four MVDA models. Venn diagrams below shows the comparison between two models individually, displaying the total number of shared proteins between respective models. UniProt accession number is indicated in parenthesis. The Venn diagrams were created in R using the Venndiagram package73.

