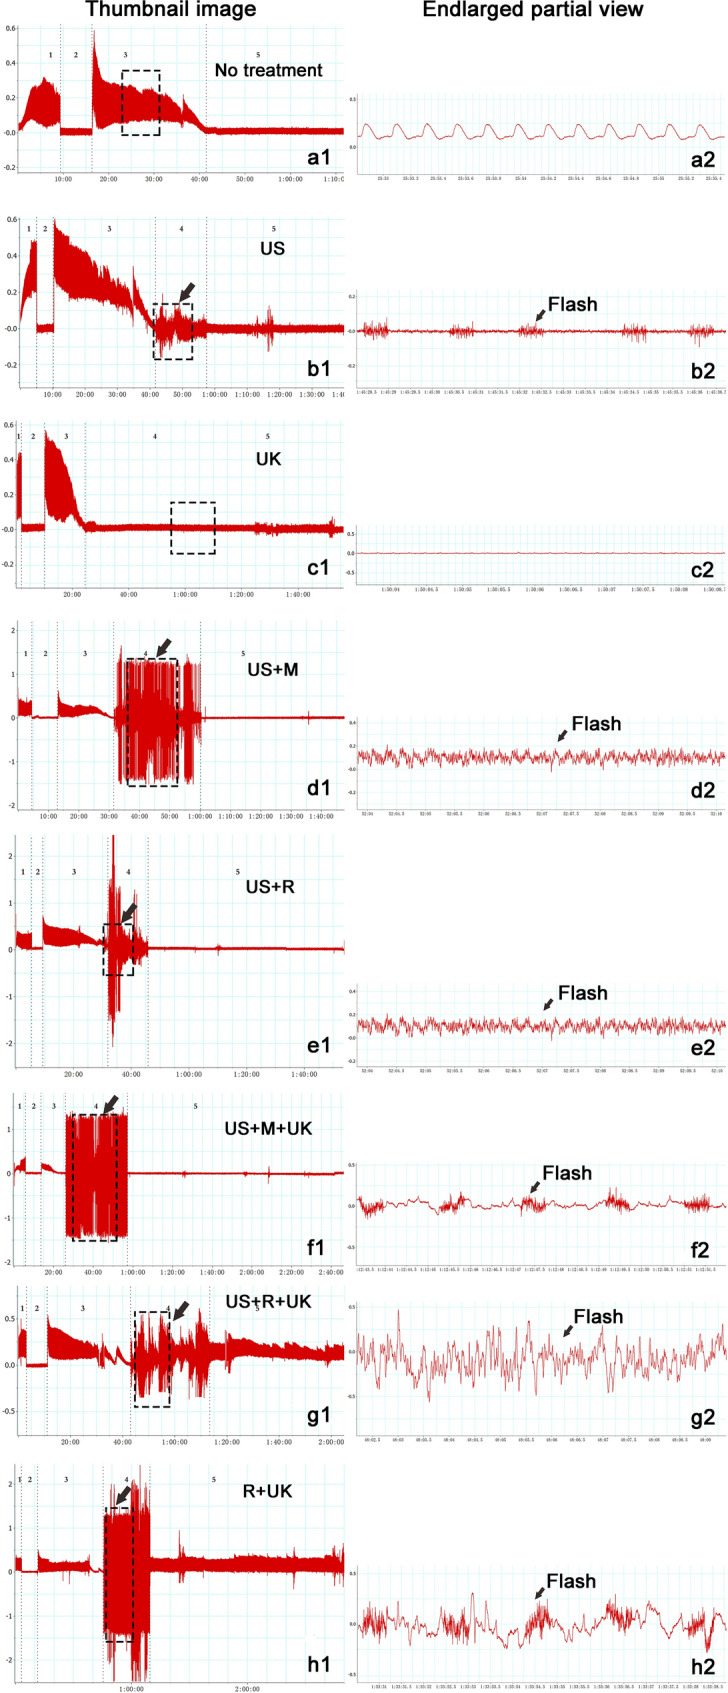
Figure 2.

Record of blood flow and wave shape in representative cases. Right side: thumbnail image, Left side: enlarged partial view. The experiment was divided into 4–5 periods according to different stages of treatment in thumbnail image. 1, Baseline: No treatment. 2, Occlusion time: Occlusive suture was placed around the artery, and there was no flow for 7 to 8 min. 3, Thrombus time: The distal clamps were loosened and occlusive thrombi were formed within 20 to 30 min in femoral arteries. 4, Thrombolysis time: different thrombolytic methods were used after forming a stable occlusion. 5, Observation time: the thrombolytic effect was observed after treatment. Black arrow: Using ultrasound to flash.
