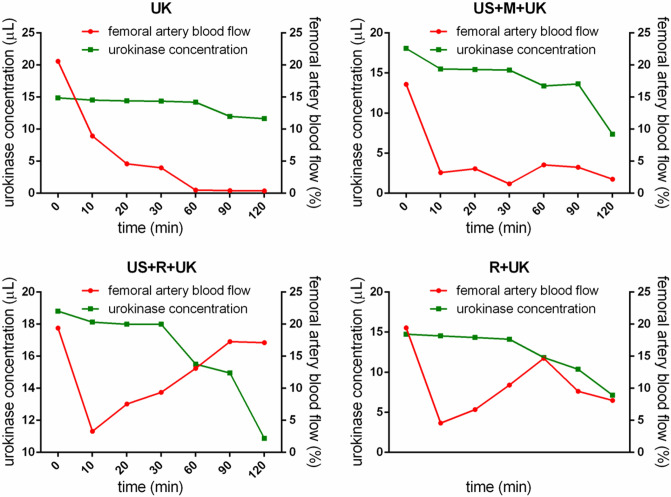
Figure 3.
Urokinase concentration and blood flow. The urokinase concentration of the R + UK and US + R + UK group dropped to the lowest point at 60 and 100 min, respectively, while the blood flow peaked at the same time points. UK: urokinase alone; US + M + UK: ultrasound, non-targeted microbubble and urokinase; R + UK: RGDS-targeted microbubble plus urokinase; US + R + UK: ultrasound, RGDS-targeted microbubble and urokinase. Squares indicate the serum concentration of urokinase. Circles indicate the femoral artery blood flow.

