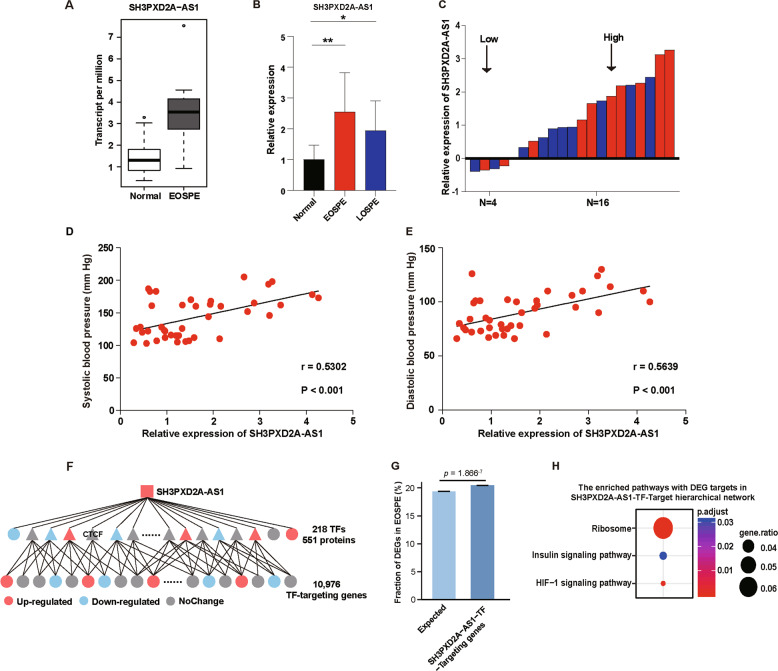
Fig. 1. SH3PXD2A-AS1 as a potential PE-causal factor.
a Boxplot of SH3PXD2A-AS1 expression levels in EOSPE placentae (n = 9) compared with normal placentae (n = 32). TPM: transcript per million. b The relative expression level of SH3PXD2A-AS1 measured by qRT-PCR. Y-axis: the fold-change; black bar: normal placentae, n = 20; red bar: placentae of patients with EOSPE, n = 10; blue bar: placentae of patients with LOSPE, n = 10; The values are shown as the mean ± S.D; **p < 0.01, *p < 0.05. c The expression level of SH3PXD2A-AS1 is upregulated in 80% (8/10) of EOSPE or LOSPE samples compared with the average level of 20 normal samples. Average expression level in normal samples was set as zero; the red bars represent expression levels in placentae of EOSPE patients; the blue bars represent expression levels in placentae of LOSPE patients. d Positive correlation (r = 0.5302, p < 0.001) between systolic blood pressure and the relative expression of SH3PXD2A-AS1 (Pearson correlation analysis). e Positive correlation (r = 0.5639, p < 0.001) between diastolic blood pressure and the relative expression of SH3PXD2A-AS1 (Pearson correlation analysis). f Hierarchical “SH3PXD2A-AS1-TF-Target” interaction network. g The targets in “SH3PXD2A-AS1-TF-Target” interaction network are enriched with DEGs in EOSPE. h The enriched pathways with DEGs as targets of “SH3PXD2A-AS1-TF-Target” interaction network.

