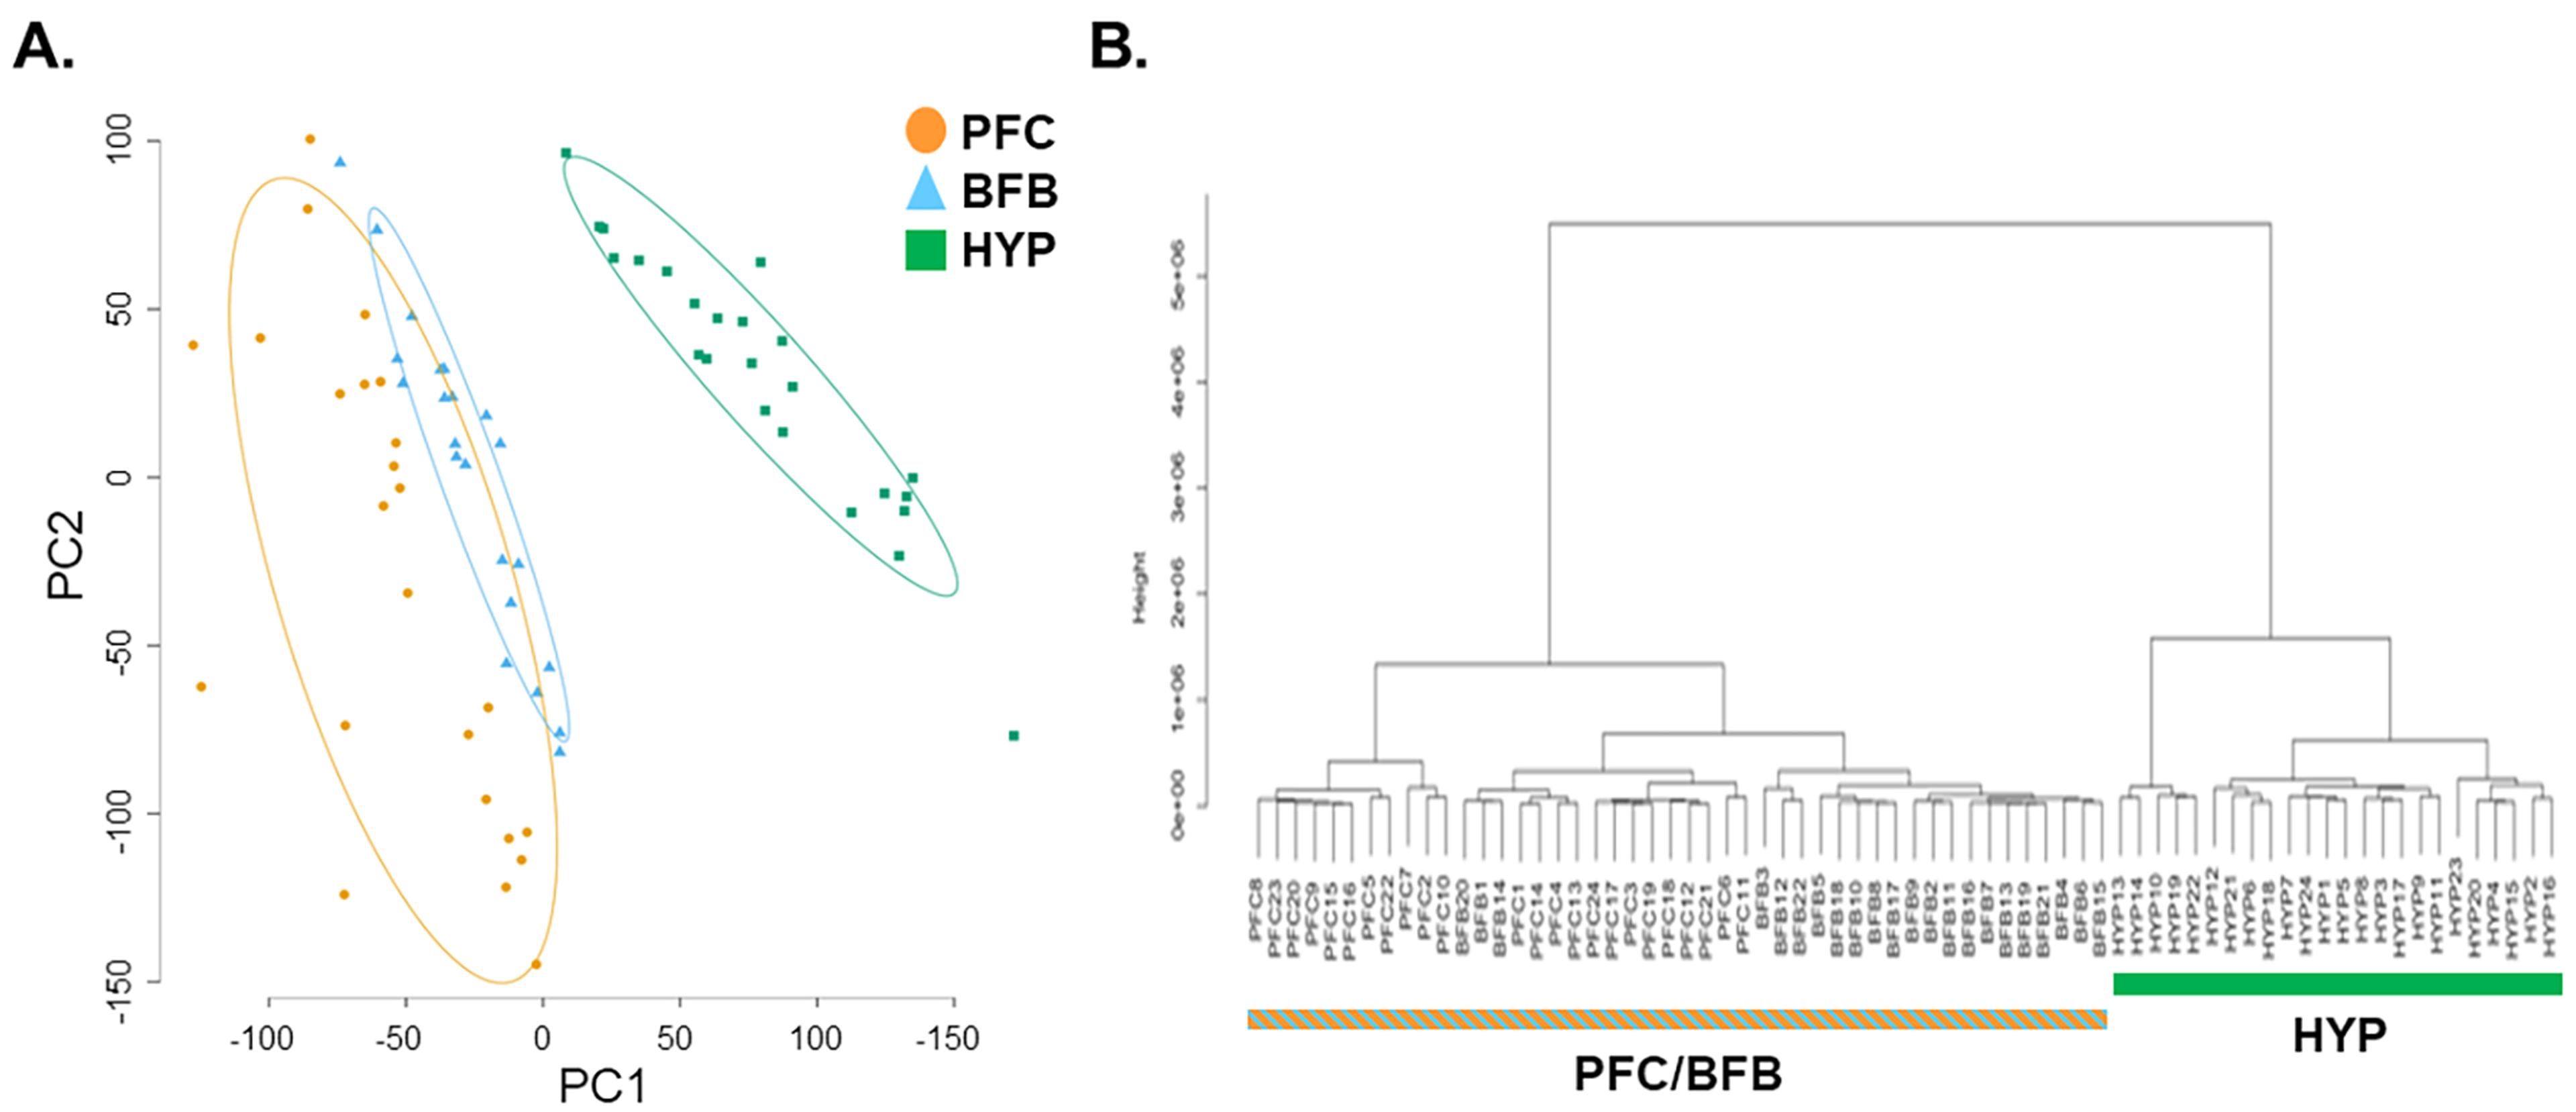
Figure 2.

PCA plot and hierarchical clustering of current hypothalamic results and previous basal forebrain (BFB) and prefrontal cortex (PFC) gene expression results. A) The PCA plot using expression of all genes shows that the fox hypothalamic transcriptome is distinct from that of PFC (cortex) and BFB (forebrain). B) Similarly, hierarchical cluster analysis using expression of all genes also shows that the fox hypothalamus transcriptome is distinct from that of cortex and forebrain.
