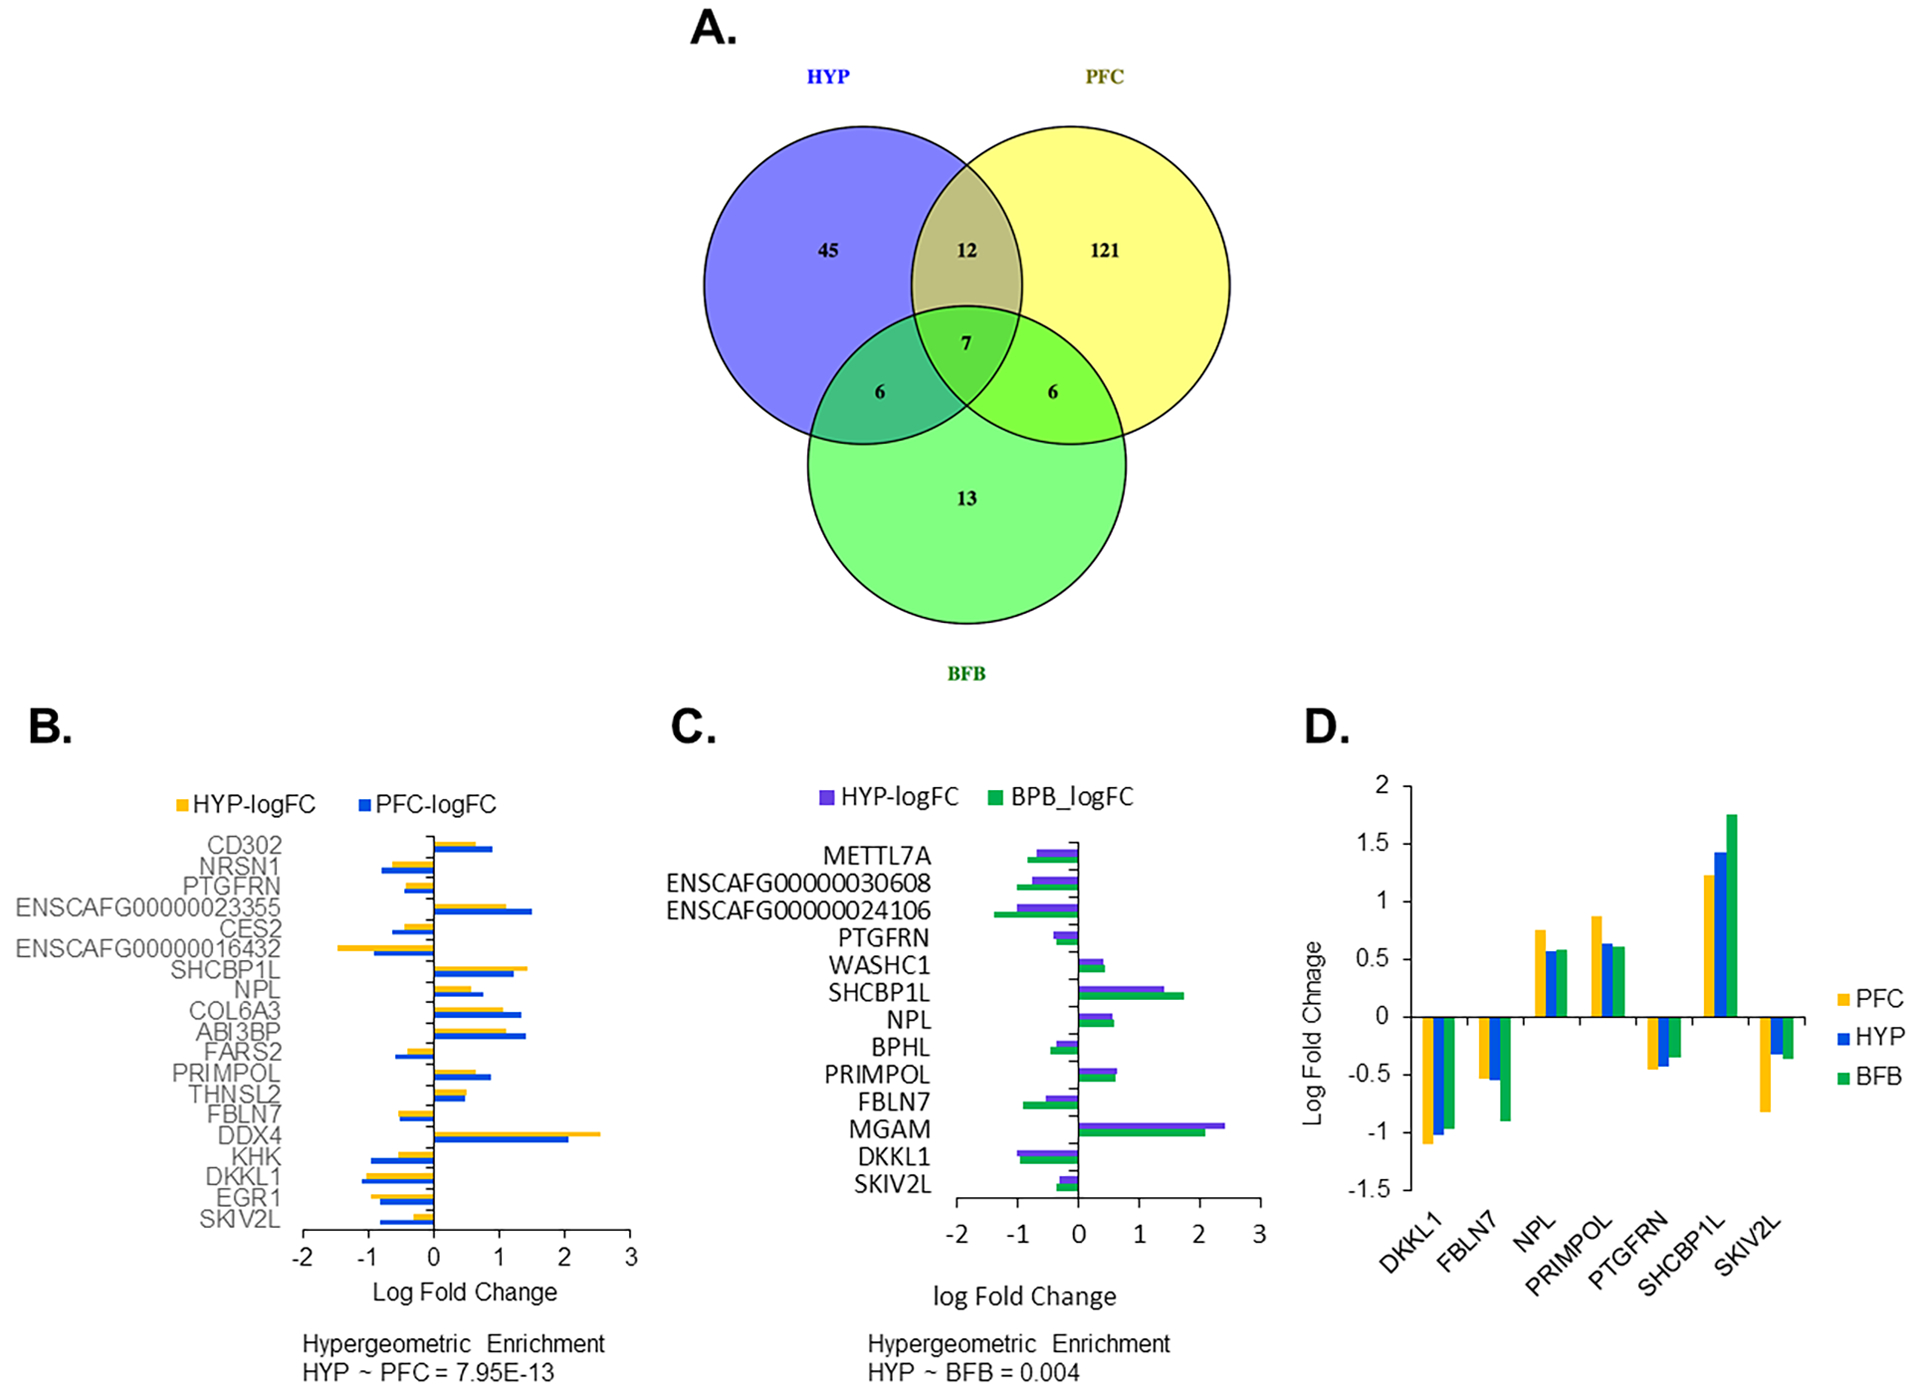
Figure 4.

Comparison of DEG identified in hypothalamus compared to those previously identified in the prefrontal cortex (PFC) and basal forebrain (BFB). A) Venn diagram showing number of DEG common or specific to hypothalamus, frontal cortex or forebrain. B and C) The expression (log fold changes between tame and aggressive) of the common genes between hypothalamus and PFC (B) and between hypothalamus and BFB (C). The enrichment was determined by calculating p-value of hypergeometric test from the number of common genes, specific genes to each and the total number of genes for each comparison. D) A column graph showing the expression (log fold changes between tame and aggressive) of the common genes among hypothalamus, PFC and BFB.
