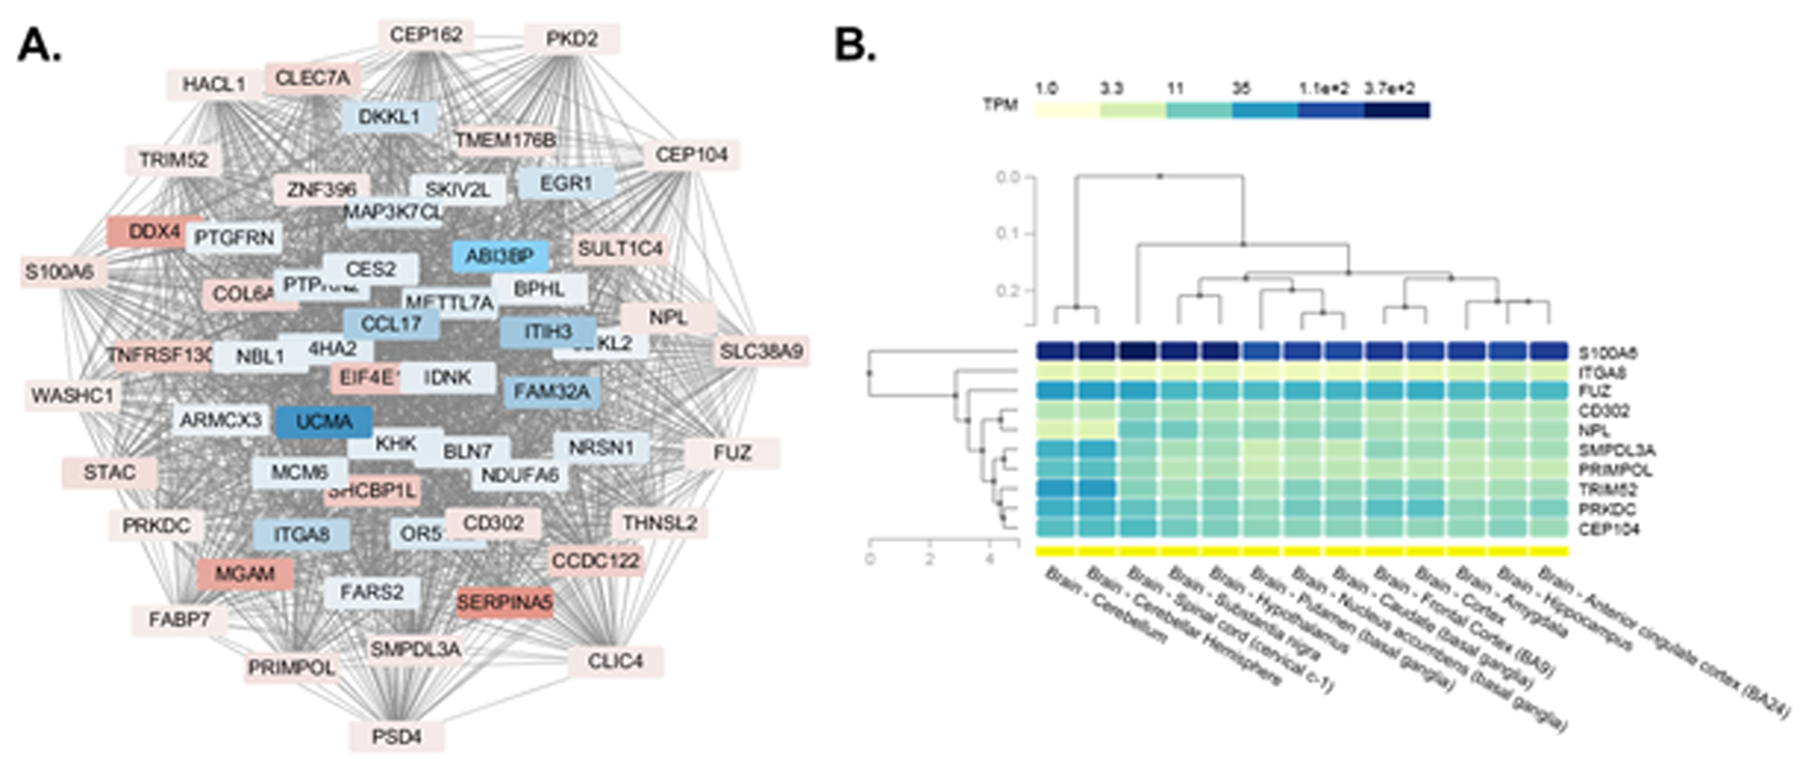
Figure 6.

Gene expression network to identify ten hub or “key player” genes and their expression pattern in human brain regions. A) The diagram shows the inter-relationships of the gene to be DE based on edgeR robust. As shown, there are connections between almost all 70 genes that are DE. This network analysis was used to identify ten key player genes within the 70 DEG. Those in blue represent genes that are downregulated in aggressive relative to tame foxes; whereas, those in red indicate genes that are upregulated in aggressive relative to tame foxes. B). Analysis of the expression pattern for the ten key player genes in various human brain regions. The GTEx Portal site (https://gtexportal.org/home/) was screened to determine the expression pattern of the identified ten key player genes that were DE in tame vs. aggressive foxes. As shown, S100A6 followed by FUZ has greatest expression in all human brain regions, including the hypothalamus.
