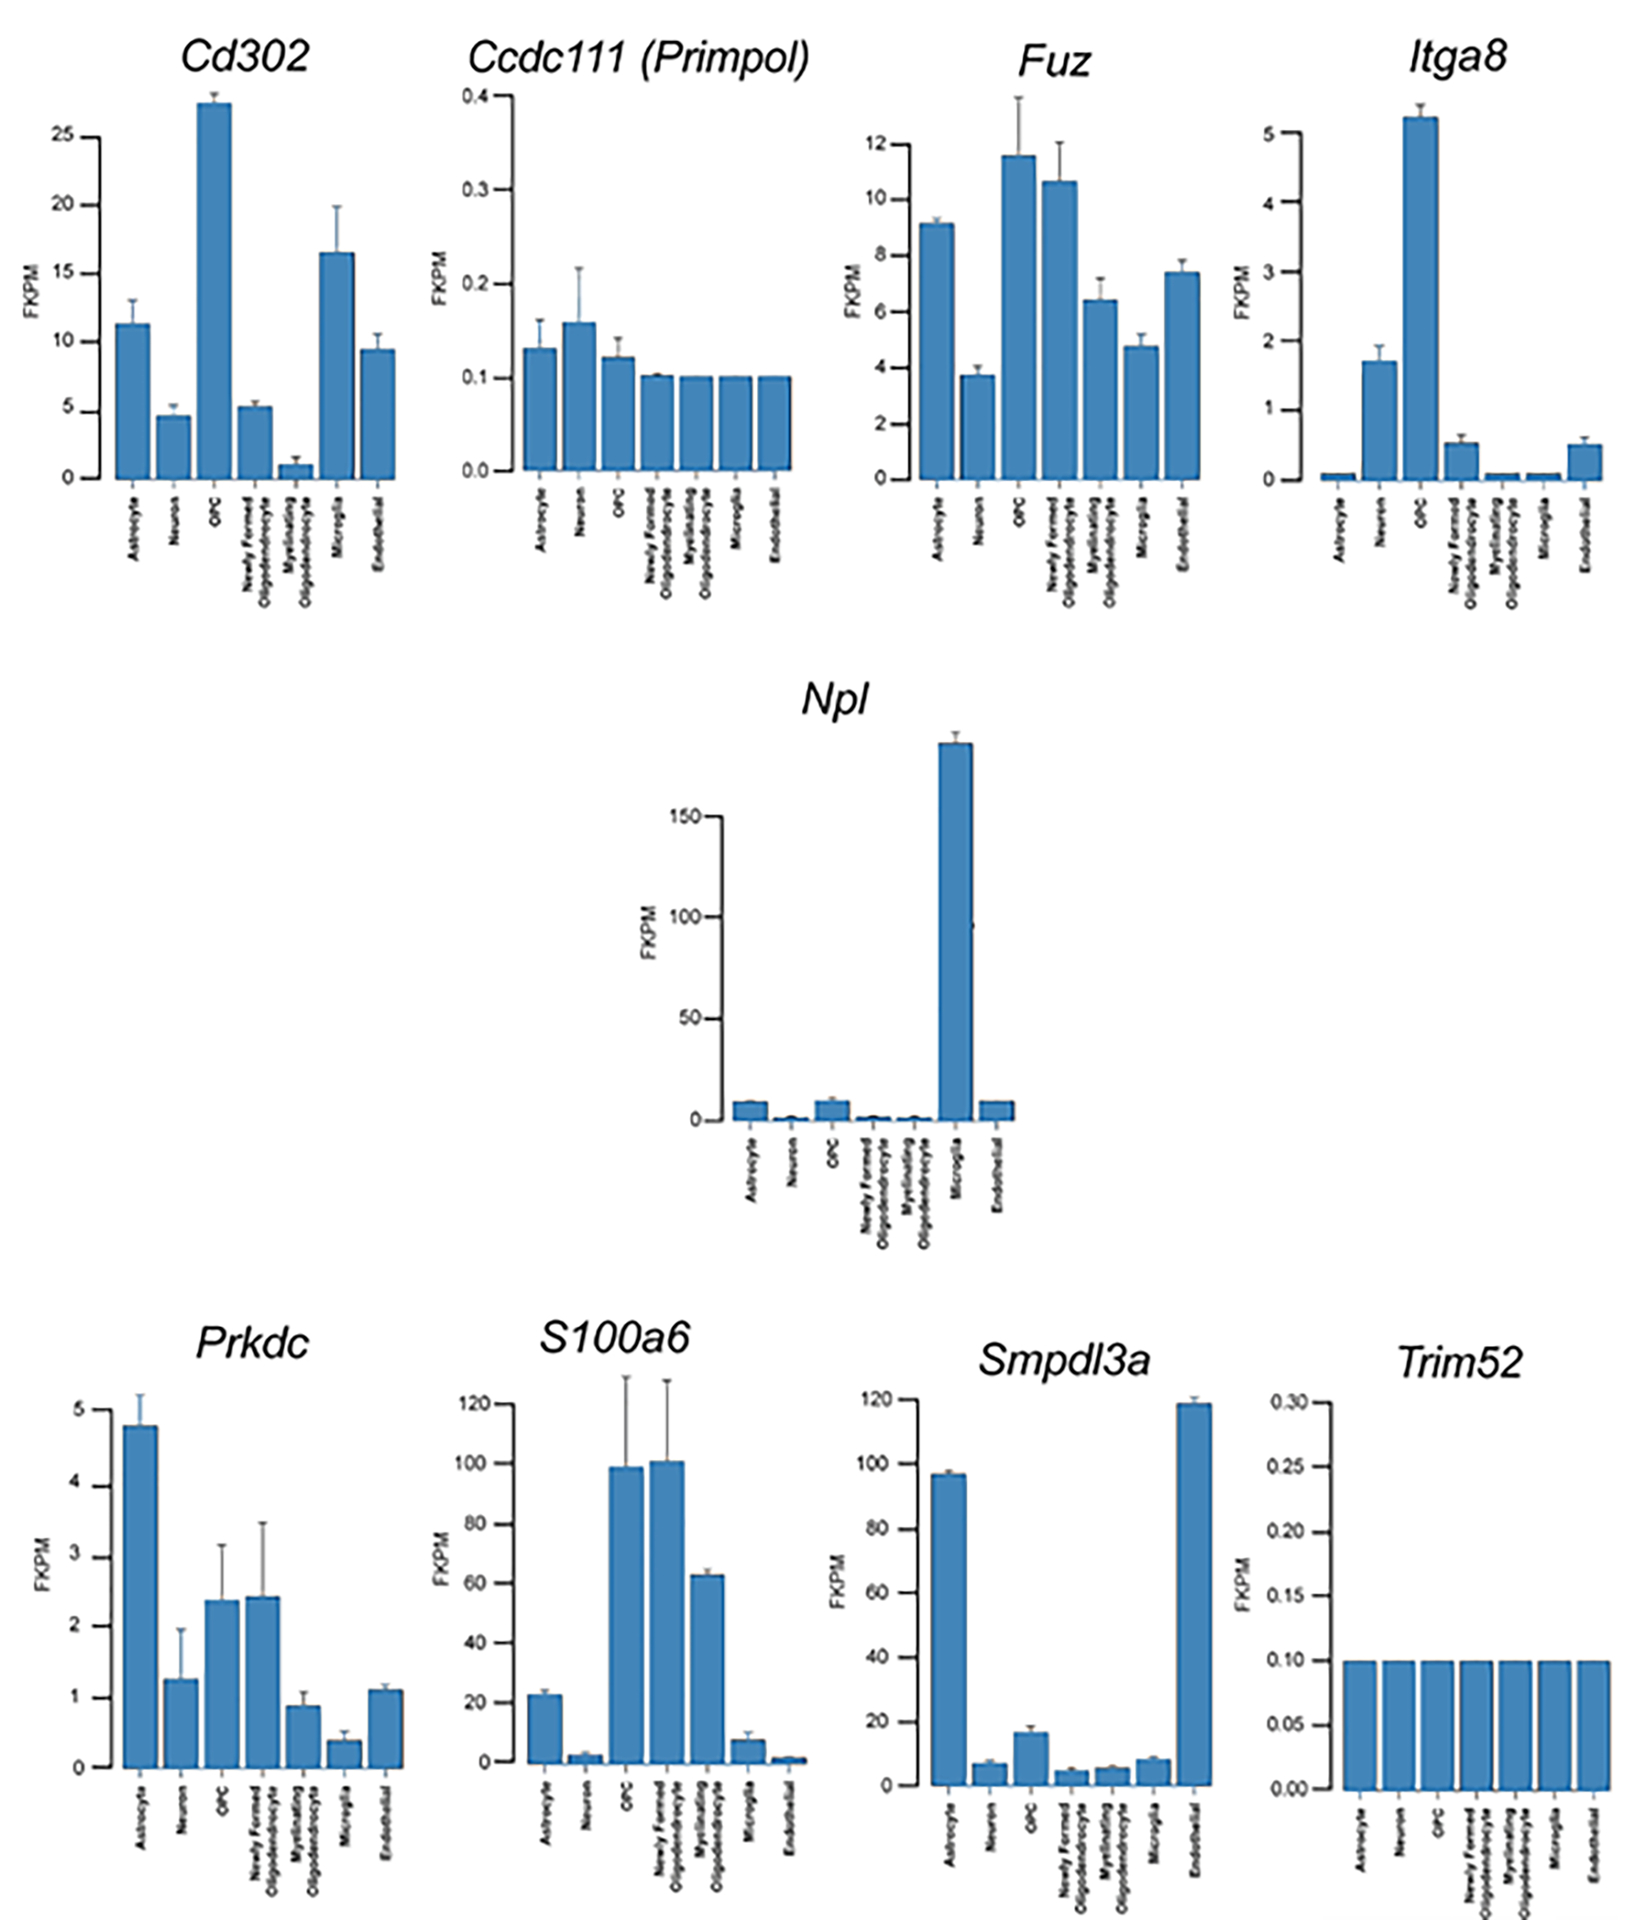
Figure 7.

Neuronal cellular analysis of the ten key player genes. To pinpoint which neuronal cells might be contributing to the difference in expression for nine of the ten key player genes, were analyzed with the Brain RNA-Seq (http://www.brainrnaseq.org/) mouse database. No information was available for Cep104. As shown, differences in DEG might arise from various neuronal cell type and depends upon the gene. More details on individual genes are provided in the Results section.
