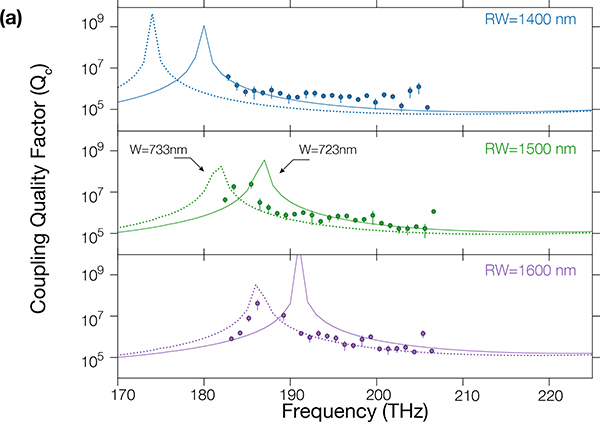
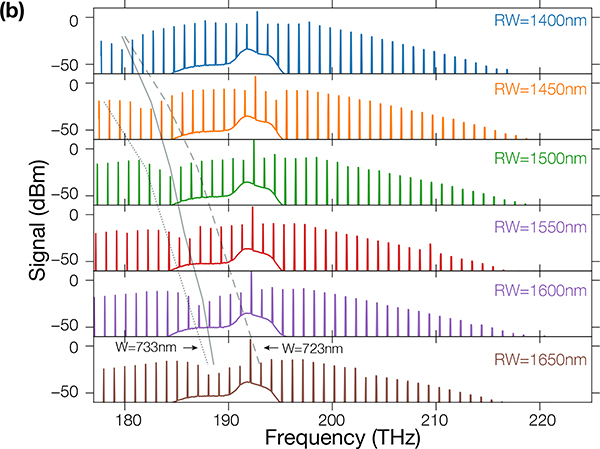
Fig. 3.
(a) Linear transmission measurement of Qc (circles) for a Lc = 40 μm pulley waveguide, for a ring width of 1400 nm (blue), 1500 nm (green) and 1600 nm (puple). The solid and dashed lines represent the simulated Qc for a waveguide width of 723 nm and 733 nm respectively. The error bars we report are one standard deviation values based on nonlinear least squares fits to the model from Ref [19]. (b) MI combs obtains for different ring widths. The dips in the comb profiles correspond to the pulley anti-phase-matched frequencies and are highlighted through the solid lines. The dotted and dashed lines represent the theoretical position of the pulley anti-phase-matched frequencies, and hence the expected dip in the MI comb spectra, for a waveguide width of 723 nm and 733 nm respectively


