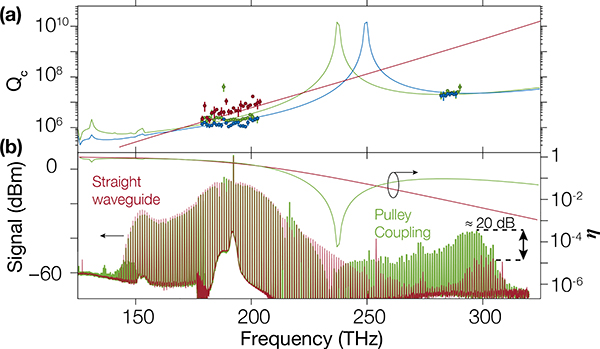
Fig. 4.
(a) Linear transmission measurement of Qc (circles) for a straight waveguide (red), and pulley coupling with Lc=15 μm (green) and Lc=17 μm (blue). Error bars are one standard deviation values extracted from nonlinear least squares fits. (b) MI comb spectra for straight waveguide (red) and pulley coupling with Lc=15 μm (green) with estimated extraction efficiency η assuming Qi = 3 × 10⁶ (right axis).

