
Fig. 3.
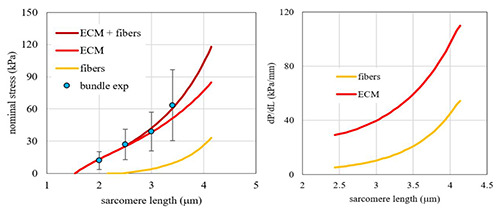
Contributions of fibers and Extracellular Matrix elasticity to the elasticity of a muscle fiber bundle. Left panel: Resting tension vs sarcomere length of fiber bundles (blue dot experimental data, means and SD, brown curve mathematical interpolation) is shown with the component due to muscle fibers (yellow curve) and the component due to ECM (red curve). Right panel: tangent stiffness vs. sarcomere length for fibers (yellow curve) and for ECM (red curve). The latter is obtained from the analytic calculation of the specific contribution of ECM to passive tension (see left panel) (from Marcucci et al 2019).60