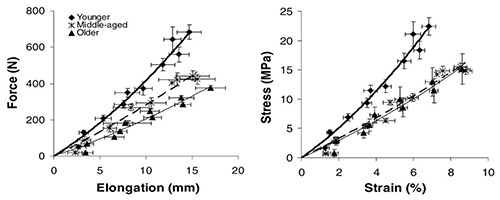
Fig. 4.

Human Gastrocnemius tendon force-elongation curves (left) and stress-strain curves (right) in three distinct age groups : young (24 y), middle age 46 y) and old (68 y). Data are means and SE. The reduction in elasticity in the elderly is easily detectable. (Reproduced with permission from Onambele et al. 2006,21 license number 4802321103155.)
