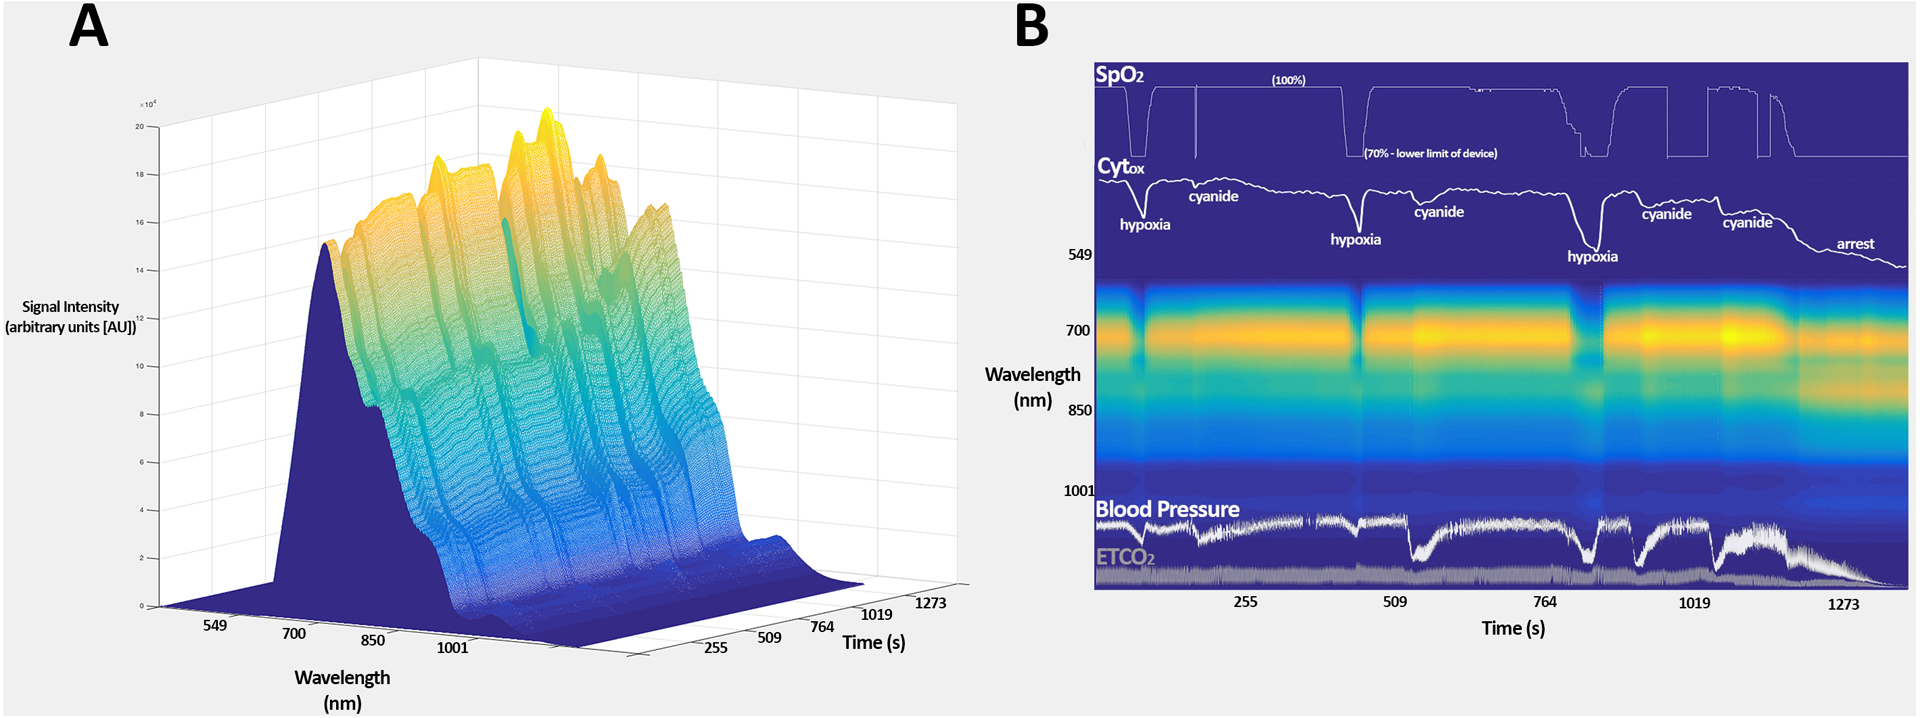
Figure 4.

A) surface plot demonstrating the recorded tissue spectra from rat 15 over time B) compressed spectral array of the recorded tissue spectra from rat 15 over time, with SpO2, Cytox arterial blood pressure, and end-tidal CO2 overlaid. Note the increased signal at approximately 820 nm (near the cytochrome peak) following injection of cyanide and at the point of cardiac arrest.
