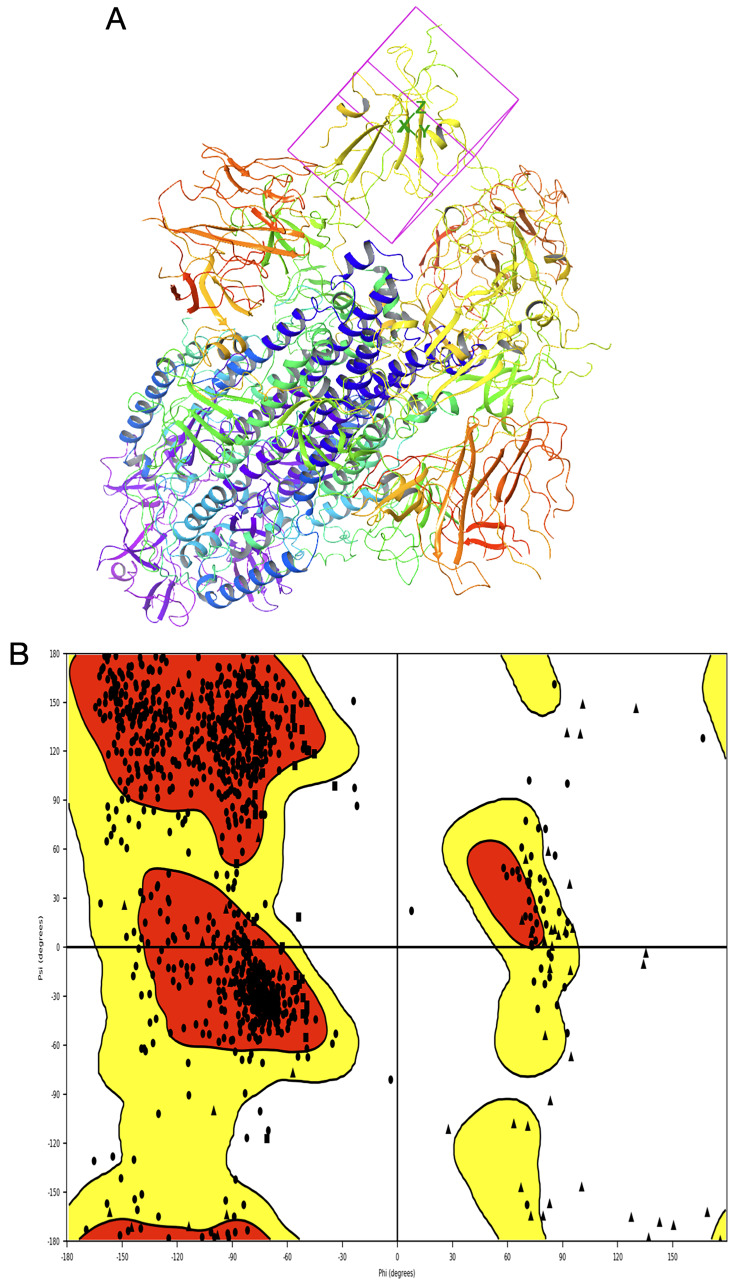
Figure 7.
A) The modelled structure of SARS-CoV-2 with Arg426, Tyr436, Pro462, Thr486, Gly488 and Tyr491 centric grid box generated for molecular docking, B) Ramachandran plot has >95% of amino acids plotted in the allowed region (red and yellow). This figure was generated using Schrodinger’s Maestro visualizer. As an alternative, the open source visualizer Python Molecule Viewer (PMV) 48 could also be used.

