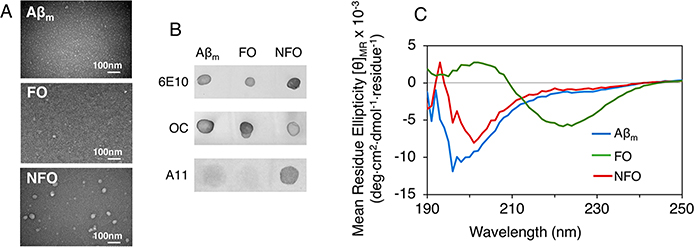
Figure 1.
Transmission electron microscopy (TEM) images (A), dot blot assay results (B), and circular dichroism (CD) spectra (C) of monomeric Aβ40 (Aβm), fibrillar Aβ40 oligomers (FOs), and nonfibrillar Aβ40 oligomer (NFOs). Aβ species were probed with antibodies for Aβ sequence (6E10), fibril structure (OC), and nonfibrillar oligomers (A11) in the dot blot assay. CD spectra shown are averages of 3–5 replicate scans.

