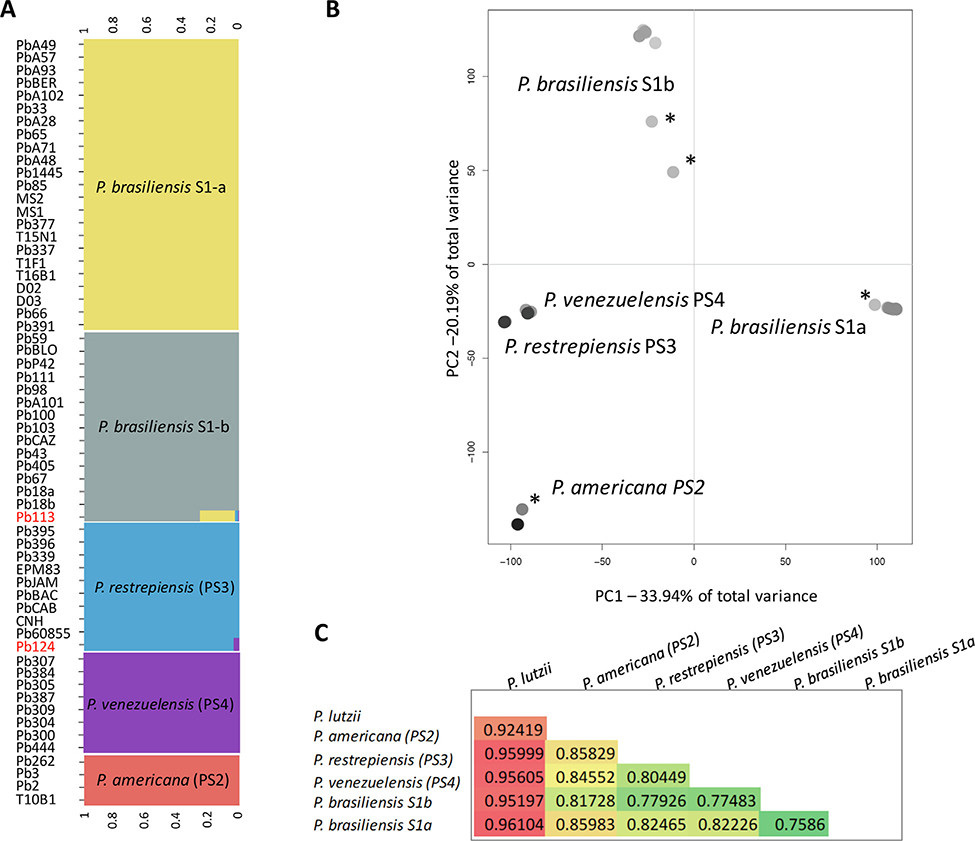
Fig. 1.
Genome wide genetic variation is portioned across species boundaries in Paracoccidioides. A. Probability of belonging to a cluster when K = 5, the most likely clustering, in Paracoccidioides based on Bayesian algorithm fastSTRUCTURE. Each column represents the genotype of an individual. B. Genetic variation in natural Paracoccidioides populations inferred by Principal Component Analysis (PCA). Only the first two PCs are plotted as they encompass over 50% of the genetic variance. The bar plots of eigenvalues (the inset plot) show the number of retained principal components. PC1 explains 33.94% while PC2 explains 20.19% of the total variance respectively. Individuals marked with asterisks represent potentially admixed strains. C. Triangular matrix showing the mean Fst value in all pairwise comparisons within the P. brasiliensis species complex.

