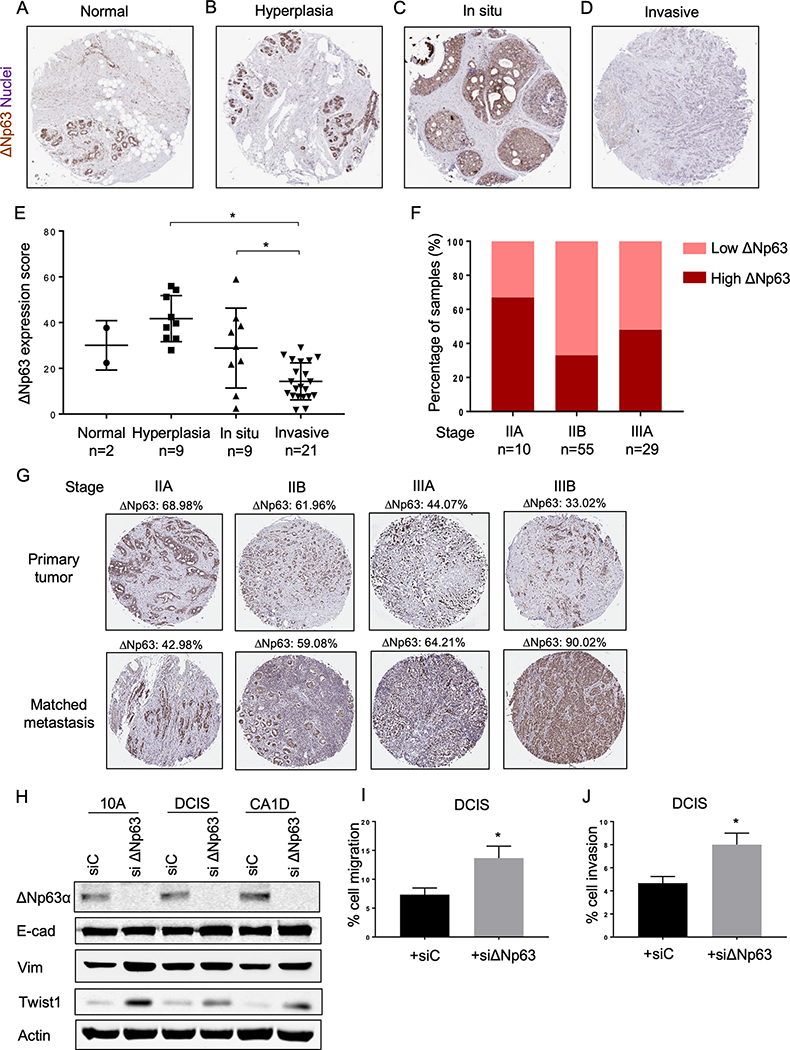
Figure 1.
Oscillatory expression ΔNp63 in breast cancer progression. A-D, Representative immunohistochemistry staining images for ΔNp63 in breast cancer tissue microarray. ΔNp63 positive nuclei are brown. Hematoxylin was used as a nuclear counterstain. 5X magnification. E, Quantification of ΔNp63 expression (ΔNp63 expression score) in breast cancer tissue microarray. Score of each sample was determined by multiplying the number of positive nuclei by the average staining intensity. Asterisk indicates p < 0.005. F, Percentage of primary tumors with either low or high expression of ΔNp63 at different stages of breast cancer. G, Immunohistochemistry staining images for ΔNp63 in invasive primary human breast tumors at different stages and matched lymph node metastases. Percentage of ΔNp63-positive tumor cells is indicated. H, Representative western blots of MCF10A (10A), MCF10DCIS (DCIS) and MCF10CA1D (CA1D) transfected with control siRNA (siC) or siRNA against ΔNp63 (siΔNp63). Immunoblots were probed with the indicated antibodies. Actin was used as a loading control. I-J, Quantification of cell migration (I) and invasion (J) assays of MCF10DCIS cells transfected with siC or siΔNp63. Data are mean ± SD. n = 3. Asterisk indicates p < 0.05.

