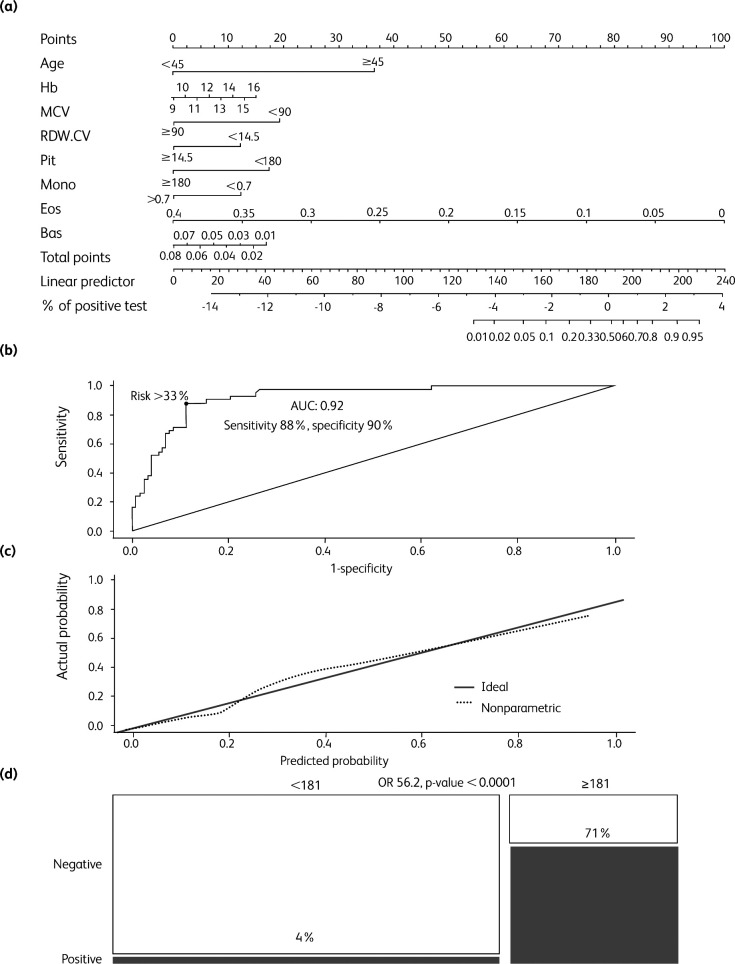
Fig 1.
Analysis of the ‘complete’ cell blood count (CBC) score (cutoff score 181, ie cutoff predicted risk 33%). (a) Nomogram for the ‘complete’ CBC score. (b) Receiver operating characteristic (ROC) curve analysis for the complete CBC score predicted probability. Optimal risk cut-off (33%) was calculated according to the Youden index. (c) Calibration plot of the ‘complete’ CBC logistic regression model. (d) Mosaic plot of patients according to test positivity and low/high risk ‘complete’ CBC score (cutoff score 181). AUC = area under the curve; bas = basophils; CBC = complete blood count; eos = eosinophils; Hb = hemoglobin; MCV = mean corpuscular volume; mono = monocytes; plt = platelets; OR = odds ratio; RDW.CV = red cell distribution width – coefficient of variation.

