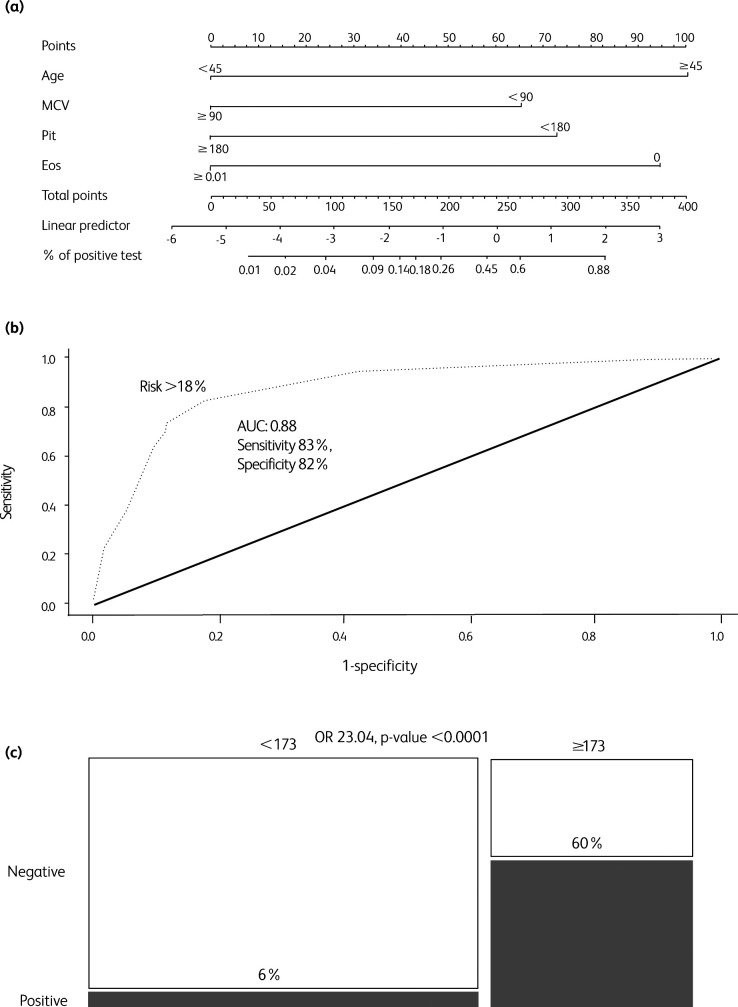
Fig 2.
Analysis for the simplified MAPE (MCV, age, platelets and eosinophils) score, with optimal risk cut-off (18%, ie score cut-off 173). (a) Nomogram for the simplified MAPE score. (b) Receiver operating characteristic (ROC) curve analysis for the MAPE score predicted probability. Optimal risk cut-off (18%) was calculated according to the Youden index. (c) Mosaic plot for high risk vs low risk MAPE score patients. AUC = area under the curve; eos = eosinophils; MCV = mean corpuscular volume; plt = platelets; OR = odds ratio.

