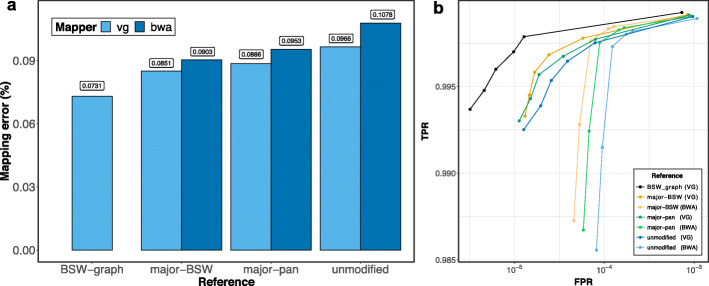
Fig. 5.
Paired-end read mapping accuracy using breed-specific augmented genome graphs and consensus linear reference sequences. a Dark and light blue represent the proportion of reads that mapped incorrectly using BWA mem and vg, respectively, to the BSW-specific augmented reference graph (BSW-graph), the BSW-specific (major-BSW) and the multi-breed linear consensus sequence (major-pan) and the bovine linear reference sequence (unmodified). b True-positive (sensitivity) and false-positive mapping rate (specificity) parameterized based on the mapping quality. The results of an analysis where reference nucleotides were only replaced at SNPs is available in Additional file 1: Fig. S13

