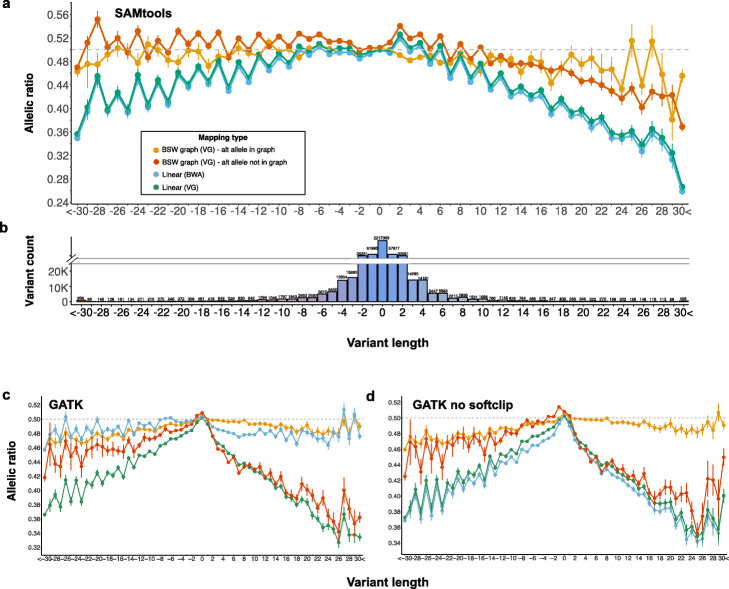
Fig. 7.
Reference allele bias from graph-based and linear alignments. Reference allele bias from graph-based and linear alignments using aSAMtools, cGATK, or dGATK without soft-clip for variant genotyping and either BWA mem or vg for alignment. Allelic ratio reflects the proportion of mapped reads supporting the alternate allele. The gray dashed line indicates equal support (0.5) for both alleles. Negative values, zero, and positive values along the x-axis represent deletions, SNPs, and insertions respectively. Each dot represents the mean (± s.e.m.) allelic ratio for a given variant length. b Number of variants with a given length. To improve the readability, the values above the breakpoint of the y-axis do not scale proportionately with the height of the bars

