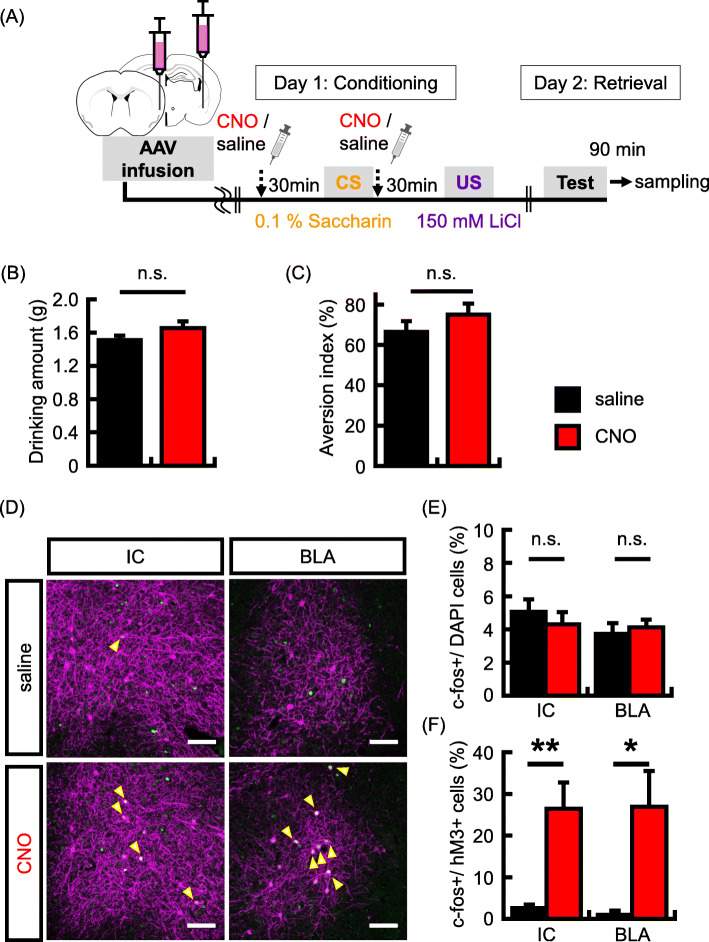
Fig. 5.
Co-activation of IC and BLA neurons regulates taste memory allocation in the IC. a Experimental schema. b Data showing the mean quantity of saccharine solution consumed during the conditioning. c Data showing the aversion index in memory retrieval test (saline group, N = 16, CNO group, N = 17 animals). d Representative images showing expression of c-fos (green) after memory retrieval test and that of hM3Dq (magenta). Yellow arrows indicate double-labeled neurons (c-fos + and hM3Dq+). Scale bars = 100 um. e-f Probability of expression of c-fos in DAPI cells (e) and in the hM3Dq + neurons (f) in the IC and BLA (IC, saline group, N = 5, CNO group, N = 6 animals; BLA, saline group, N = 5, CNO group, N = 6 animals). Data are represented as mean ± SEM; *p < 0.05 and **p < 0.01 (saline-injected mice, black columns; CNO-injected mice, red columns)

