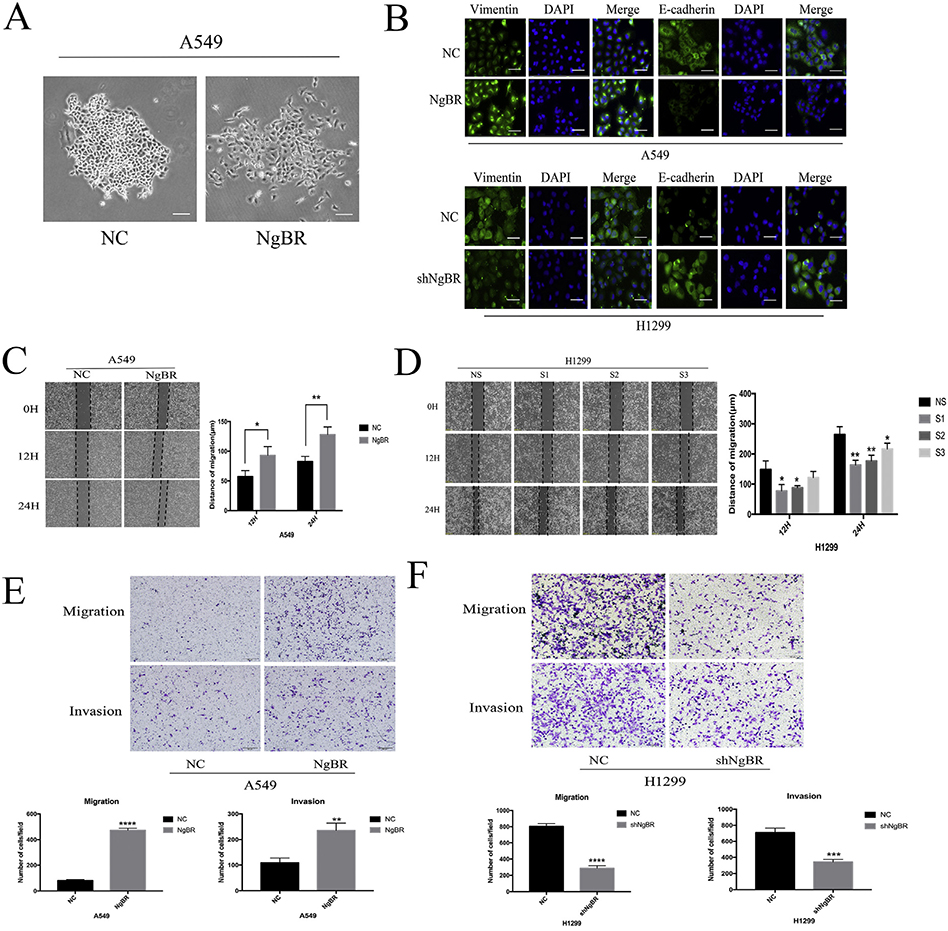
Fig. 3. NgBR expression regulates NSCLC cells migration and invasion capacity in vitro.
A, cell morphology in stable NgBR-overexpressed A549 cells. Scale bar, 200 μm. B, A549 and H1299 cells were stably transfected with NgBR cDNA or shRNA and then subjected to immunostaining of Vimentin and E-cadherin antibodies, while cell nuclei were visualized with DIPA staining. Scale bar, 37 μm. C, A549 cells were transfected with pIRES-NgBR (NgBR) or pIRES-NC (NC) for 72 h and then subjected to the wound-healing assay. Images were taken at 0 h, 12 h, and 24 h. Scale bar, 200 μm. D, H1299 cells were transfected with NgBR siRNAs (S1, S2 and S3) or All-Star non-silencing siRNA (NS) for 72 h and then subjected to the wound-healing assay. Images were taken at 0 h, 12 h, and 24 h. Scale bar, 200 pm. Error bar, SD of three independent experiments. *p < .05 and **p < .01. E and F, transwell assays assessed tumor cell migration and invasion capacity in stable NgBR overexpressed or knocked down A549 and HI299 cell lines. Images were taken at 24 h in A549 cells and at 8 h (migration), 12 h (invasion) in H1299 cells, respectively. Scale bar, 100 μm. Error bar, SD of three independent experiments. **p < .01, ***p < .001, and ****p < .0001.

