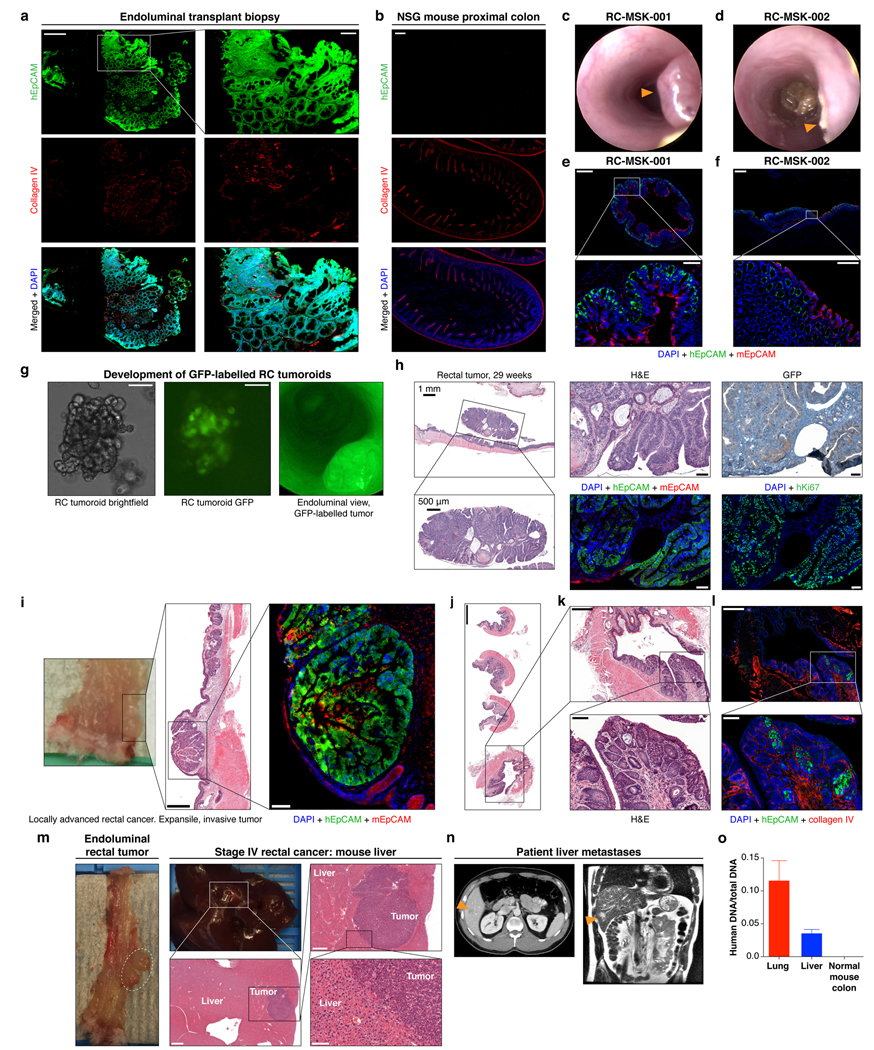
Extended Data Fig. 9 |. Demonstration of endorectally implanted human rectal cancer.
a, The RC-MSK-001 endoluminal mouse biopsy represented in Fig. 3a shows serially sectioned and stained hEpCAM; collagen IV; merged with DAPI. n=5 mice scale bars: 200 μm; inset, 50 μm. b, Colon from an unimplanted NSG mouse as control for a. Scale bars, 200 μm. c-d, 12-week endoscopy of a mouse transplanted with RC-MSK-001 (n=5) or RC-MSK-002 (n=7) tumoroids. e-f, Distinct staining was noted for human and mouse EpCAM for RC-MSK-001 (n=5) and RC-MSK-002 (n=7) engrafted NSG mice. Scale bars: 500 μm; inset, 50 μm. g, RC-MSK-001 tumoroids labeled with GFP and viewed by brightfield (left), intravital GFP imaging (middle; endoscopically (right). Scale bars, 100 μm. h, Invasive rectal tumor after RC-MSK-001 tumoroid implantation (n=7 mice) stained for H&E, GFP (IHC), and IF (hEpCAM, mEpCAM, and hKi67, each merged with DAPI). i, Independent experiment similar to Fig. 3c of one male NSG mouse sacrificed at 22 weeks post-transplantation. Implanted rectal tumor, H&E, and IF (hEpCAM, mEpCAM, DAPI) showing engraftment and invasion of human tumoroids. Scale bars: H&E, 500 μm; IF, 100 μm. j-l, RC-MSK-001 endorectal tumor 16 weeks post-transplantation (n=3 mice). H&E demonstrates invasion at the junction between the columnar and squamous epithelium of anorectal junction. j/k, H&E; l, DAPI + hEpCAM + collagen IV; Scale bars are as follows: j, 1,000 μm; k-l: 400 μm; insets, 100 μm. m, Liver metastasis in an independent experiment (see Fig. 3d) after rectal transplantation in a male NSG mouse sacrificed at 36 weeks. Liver metastasis shows poorly differentiated histology. Scale bars for H&E: 1,000 μm, 500 μm, 100 μm. n, Axial and coronal CT images of liver metastases in the corresponding patient (arrowheads) discussed in m. o, Human-specific Alu qPCR demonstrates that the metastases in Fig. 3d and current panel m arose from implanted human tumoroids (Results based on three independent RNA isolates). Mean ± s.d. Staining: hEpCAM (green), hKi67 (green), mEpCAM (red), Collagen IV (red), and DAPI (blue).

