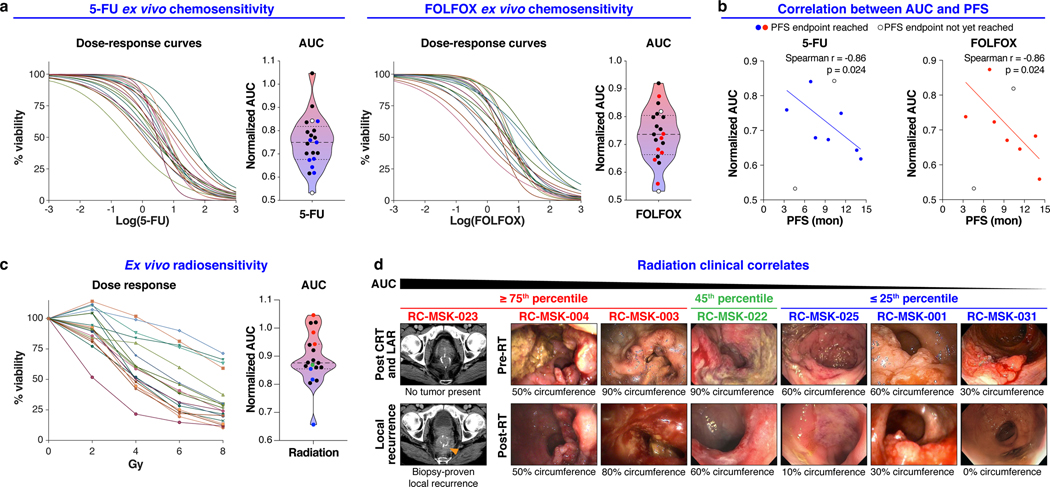
Fig. 2 |. Clinically relevant responses to chemotherapy and radiation in rectal cancer tumoroids ex vivo.
a, Ex vivo chemosensitivity of 21 RC tumoroids to 5-FU and FOLFOX in the form of dose response curves are displayed for each tumoroid (n=2 or 3 independent experiments for each). Area under the curve (AUC) was calculated from the raw dose response data and is displayed as a violin plot; dashed line and dotted lines represent mean and upper/lower quartiles, respectively. Colored data points indicate those tumoroids referenced in b. b, Correlation between AUC and progression free survival (PFS) for the seven patients (n=7) who have a PFS endpoint are displayed (Two-tailed Spearman correlation: Spearman r = 0.86, p = 0.024 for both treatment conditions). Data for both 5-FU and FOLFOX is shown. The linear regression line is plotted. c, Ex vivo radiosensitivity of 19 RC tumoroids (n=2 or 3 independent experiments for each tumoroid) is shown with corresponding AUC calculated and displayed as in a. Colored data points indicate those tumoroids referenced in d. d, Endoscopic clinical responses to radiation are displayed for each patient and ranked by AUC, descending left-to-right as indicated. The percent of the bowel circumference involved by tumor pre- and post-radiation (pre- and post-RT) is displayed as assessed endoscopically by a colorectal surgeon. The RC-MSK-023 tumor is shown radiographically in the left-most panel as a local recurrence following chemoradiation (CRT) and low anterior resection (LAR). The tumoroids are categorized from left to right as ≥ 75th percentile (red), 45th percentile (green), and ≤ 25th percentile (blue) with corresponding color-coded data points indicated in c.

