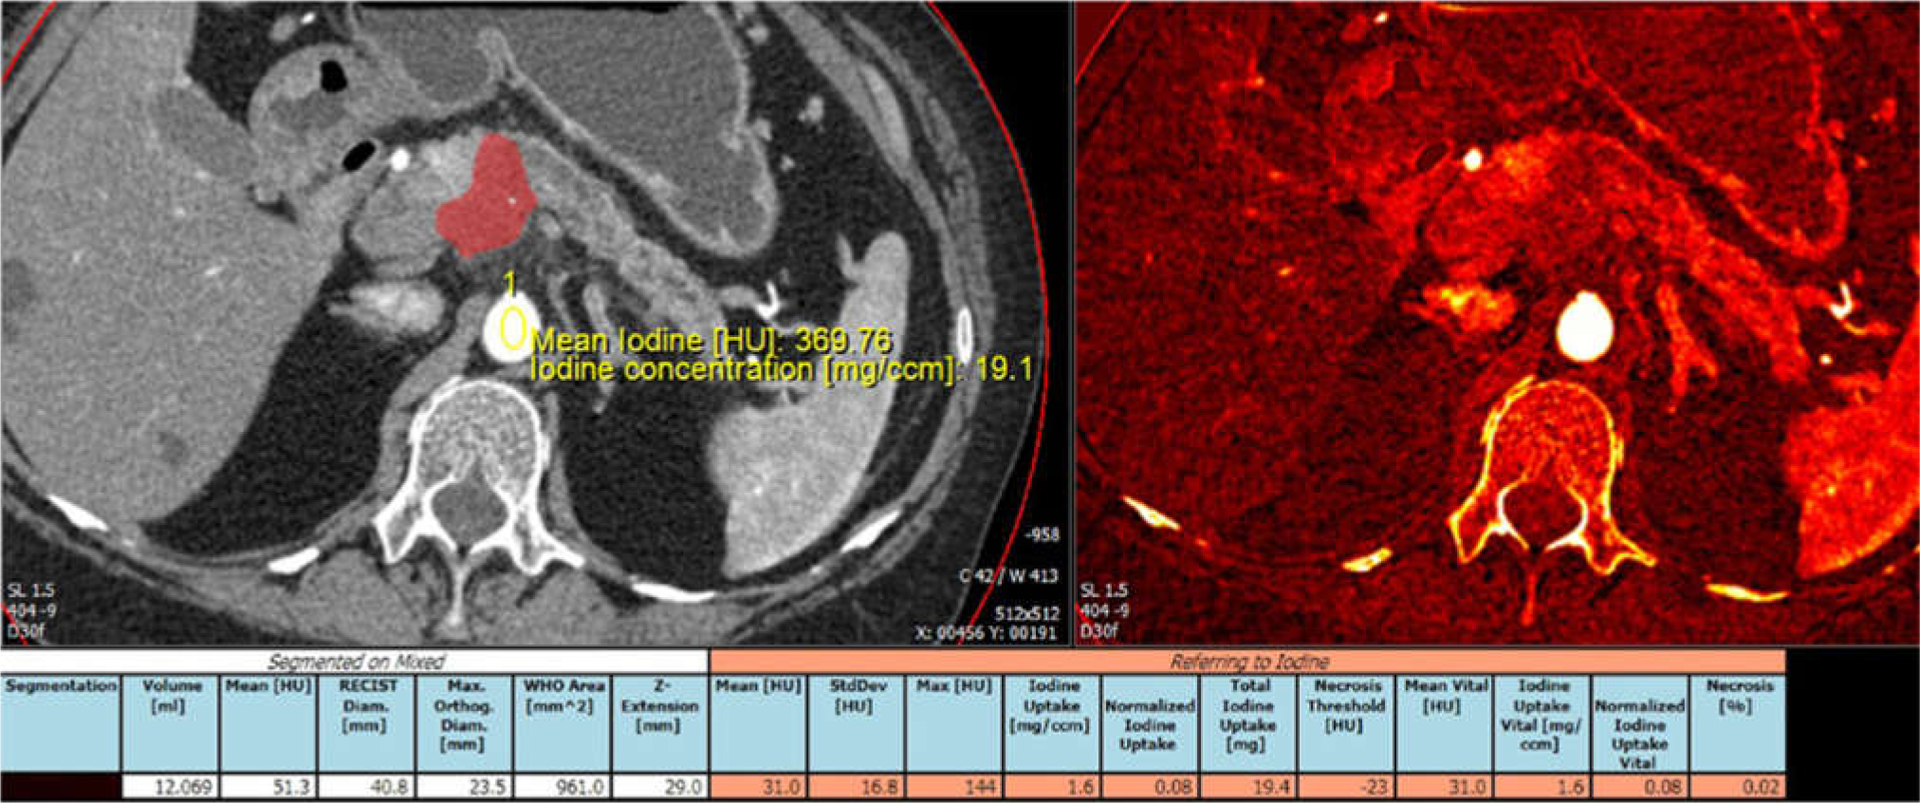
Fig. 1.

Example of tumor segmentation and iodine uptake measurement. Arterial phase CT image and iodine overlay image displayed side by side. Automated segmentation was followed by manual editing through the entire tumor volume. Tumor was segmented and color displayed. Aortic iodine uptake acquired by placing ROI over the aorta was used to obtain normalized tumor iodine uptake.
