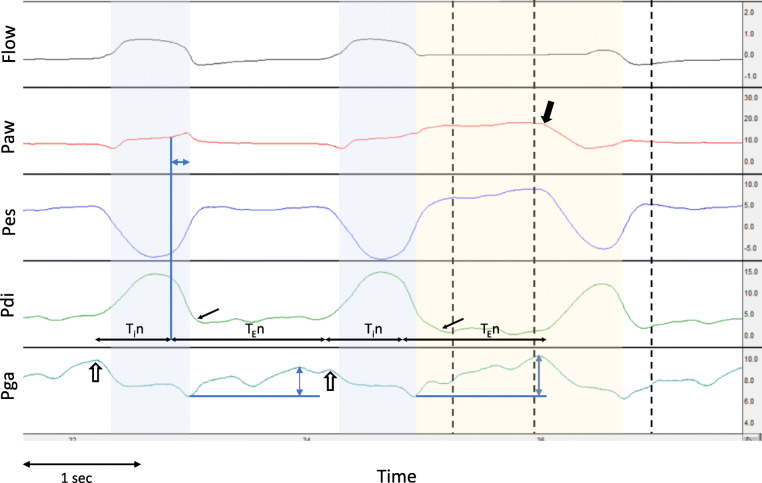
Fig. 1.
Waveform analysis of end-inspiratory occlusion. Representative waveforms of flow (in l s), airway (Paw), esophageal (Pes), transdiaphragmatic (Pdi), and gastric (Pga) pressures (in cmH2O), from one patient, with an end-inspiratory occlusion on the second breath. The blue-shaded area indicates the mechanical inspiratory time, and the yellow-shaded area indicates the end-inspiratory occlusion. Horizontal black arrows indicate the start and end of neural inspiration (Tin) and expiration (TEn). The point of rapid decline of Pdi (end of neural inspiration) is indicated by the blue vertical line, and the horizontal blue double-headed arrow in Paw indicates the cycling off delay. The small black arrows in Pdi indicate the point of complete relaxation of the diaphragm. Black vertical dashed lines indicate the points at 0.3, 1, and 2 s post-occlusion. The thick black arrow in Paw shows the end of the plateau by the sudden decrease in Paw, due to diaphragmatic contraction during occlusion. Observe that the neural inspiratory and expiratory times are similar in the un-occluded and occluded breath, and the occlusion time is less than 2 s. Expiratory muscle activity is indicated by the rise of Pga, during expiration in the un-occluded breath, and during the end-inspiratory occlusion (blue double-headed arrows show the maximum change). Notice also the decrease of Pga at the onset of inspiration, suggesting the relaxation of expiratory muscles at this point (open arrows)

