
Figure 1.
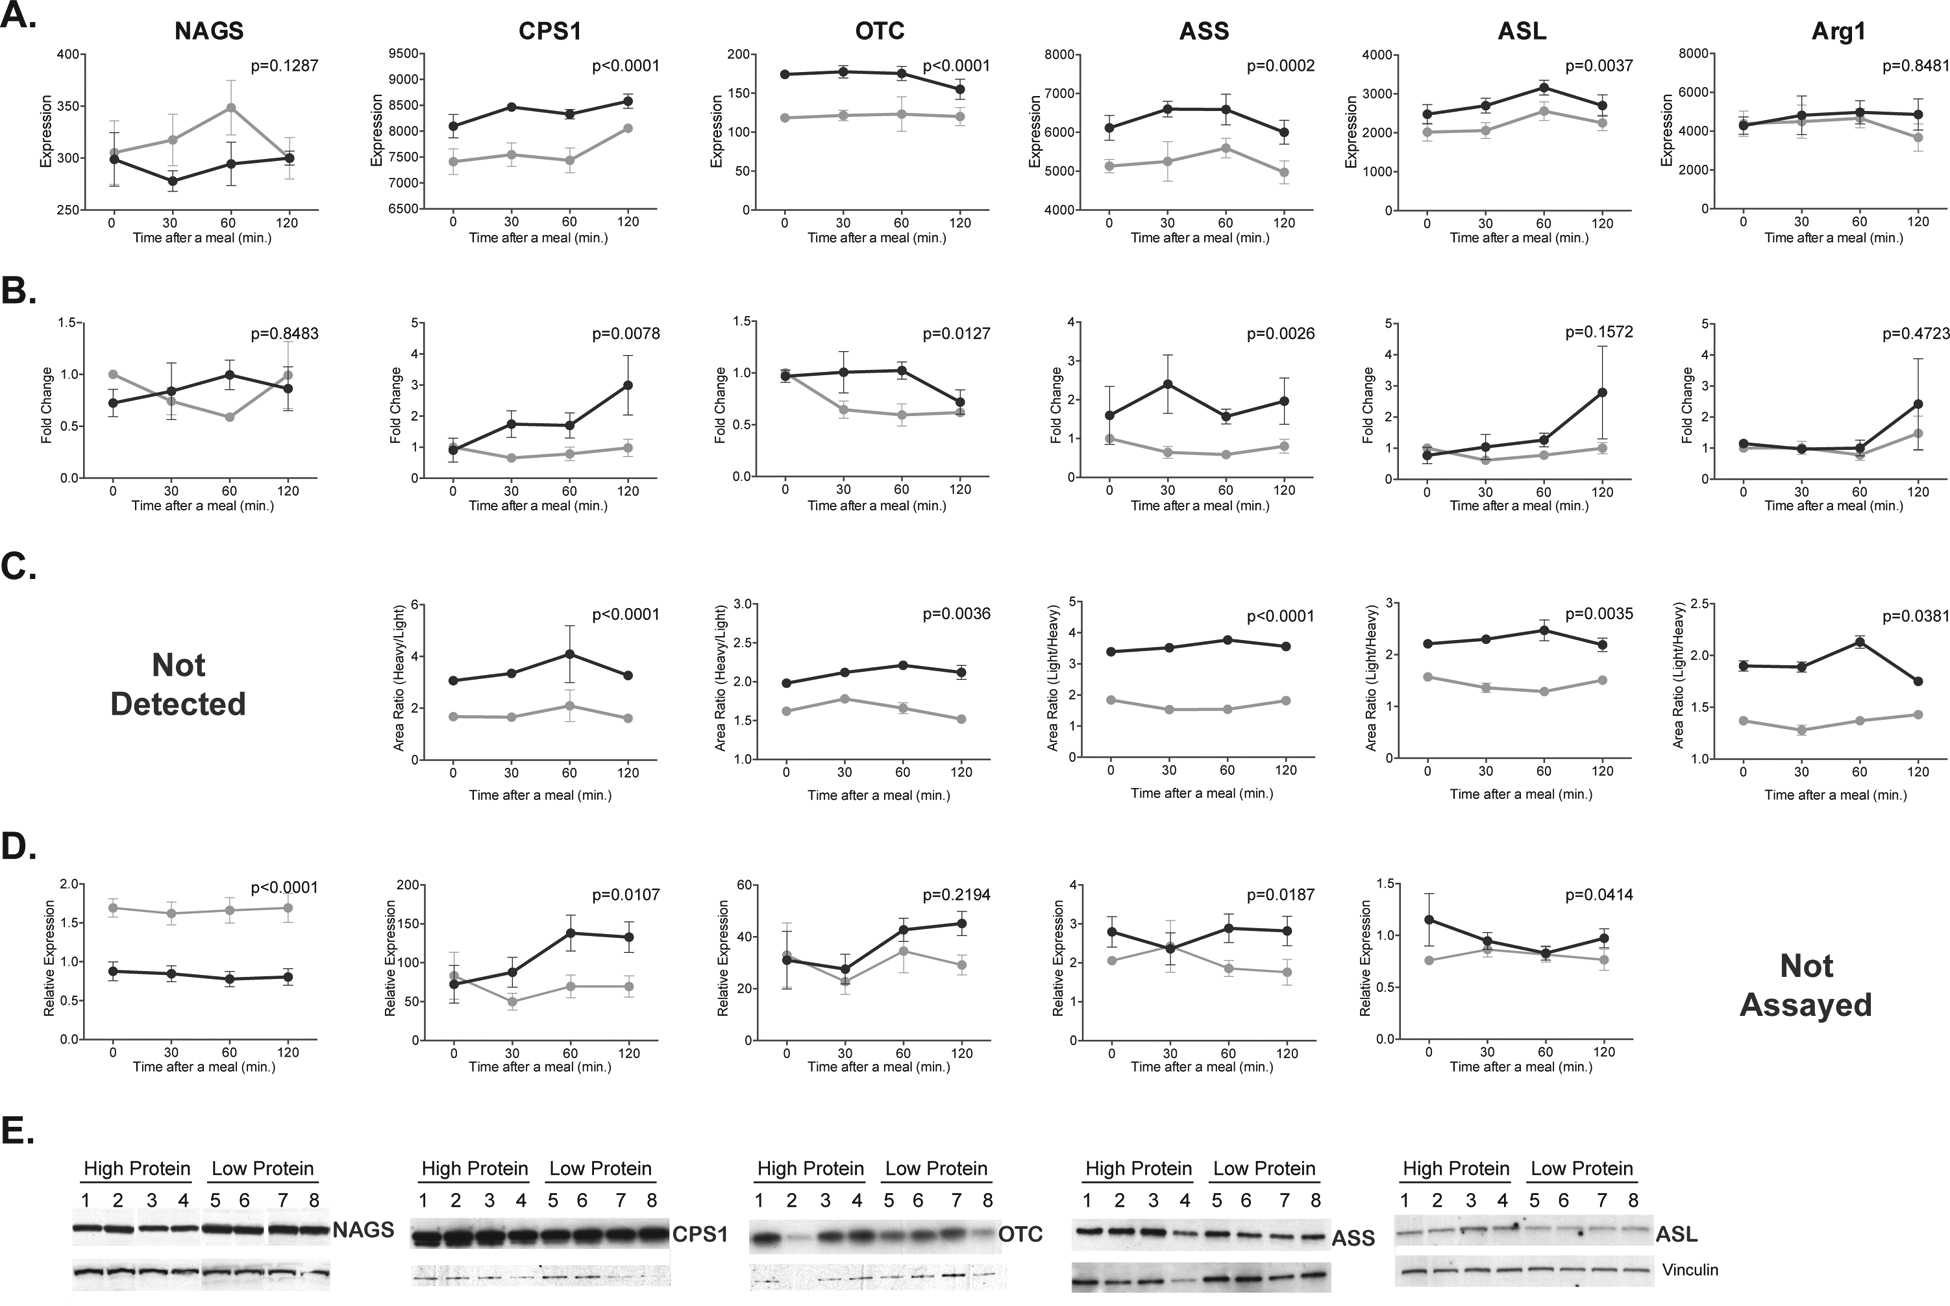
Expression of urea cycle genes and enzymes in mice fed either HP (dark gray) or LP (light gray) diets. The mRNA abundance was measured using Affymetrix microarrays (A) and validated with quantitative RT-PCR in a different cohort of mice(B). The abundance of urea cycle enzymes was measured using spike-in mass spectrometry (C) and validated with immunoblotting in a different cohort of mice (D and E). Abundance of mRNA and proteins was measured at fasting and 30, 60 and 120 min. after introduction of food. Each data point is a mean and associated SEM of 4 measurements.