
Figure 3.
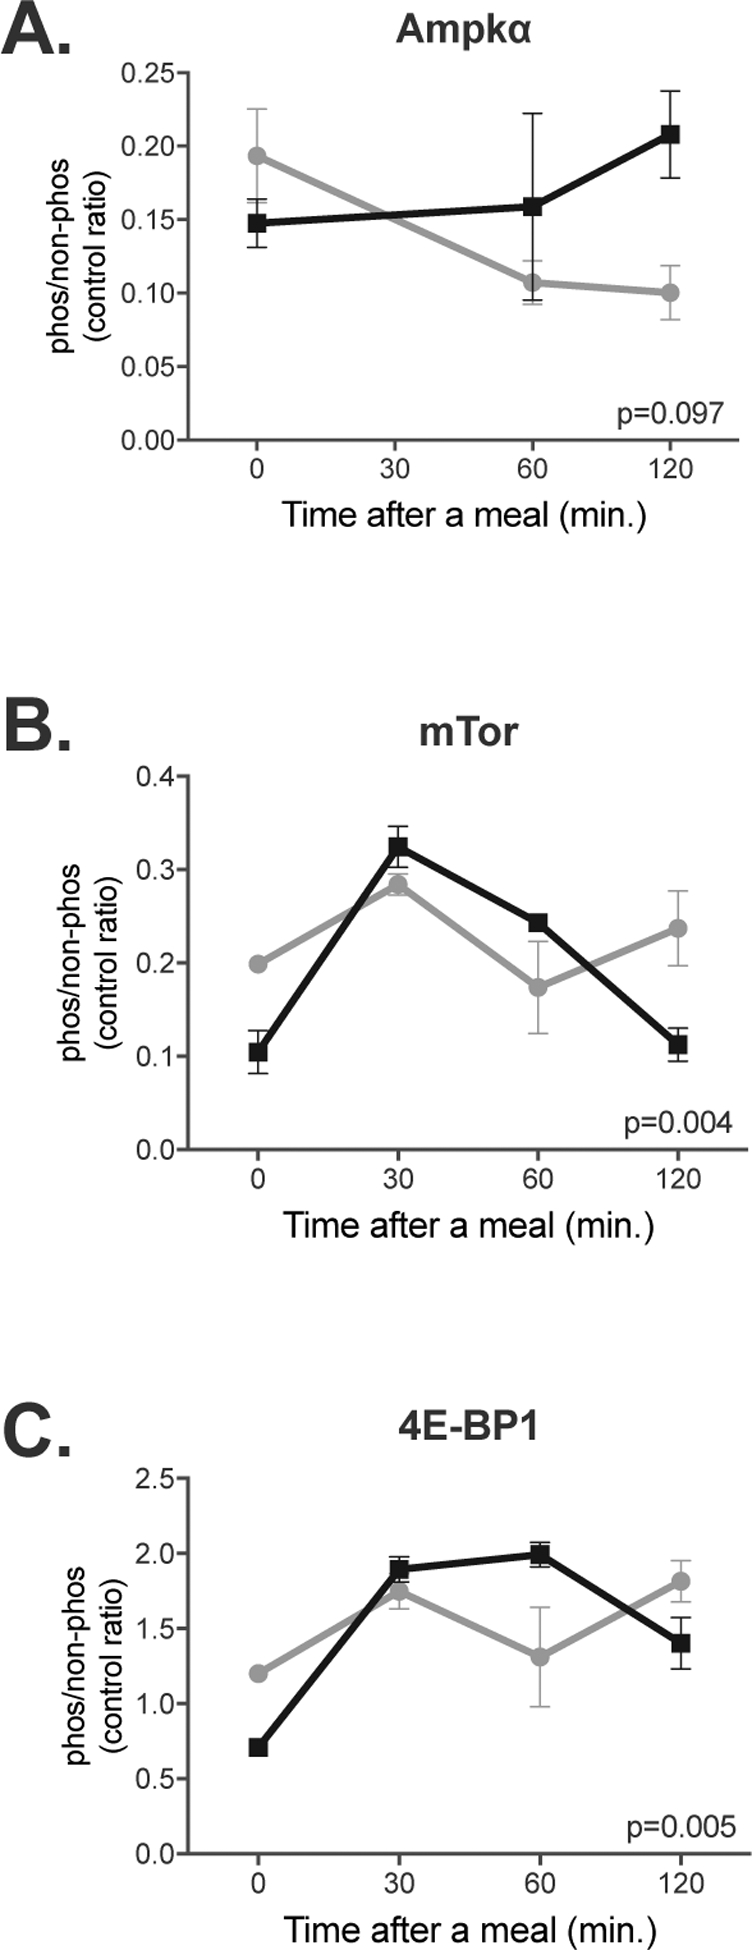
Changes in phosphorylation of Ampk (A), mTor (B) and 4E-BP1 (C) in the livers of mice fed either HP or LP diets. Phosphorylation was measured at fasting and 30, 60 and 120 min. after introduction of food. The ratio of phosphorylated and non-phosphorylated protein was normalized to β-actin abundance. Each data point is a mean and associated SEM of either 4 (Ampk) or 3 (mTor and 4E-BP1) measurements.