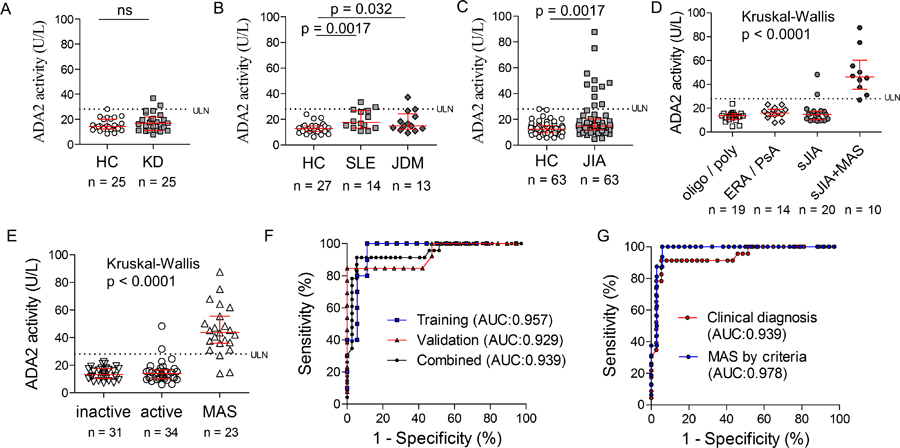
Figure 2.

Comparison of ADA2 activity levels in childhood inflammatory diseases. A) Peripheral blood ADA2 levels in patients with Kawasaki disease during the acute phase of illness and age-matched healthy controls (n = 25 per group). B) Peripheral blood ADA2 levels in patients with pSLE (n = 14), patients with JDM (n = 13) and age-matched healthy controls (n = 27). C) Peripheral blood ADA2 levels in all patients with JIA and age-matched healthy controls (n = 63 per group). D) Peripheral blood ADA2 levels in patients with JIA stratified by disease category based on the ILAR classification. E) Stratification of plasma ADA2 levels in sJIA patients by disease activity and MAS (training and validation cohorts combined; n = 88). F) ROC curve of ADA2 in distinguishing active sJIA with or without MAS in training, validation and combined patient cohorts. G) ROC curve of ADA2 in distinguishing active sJIA with or without MAS diagnosed clinically or MAS diagnosed according to the 2016 MAS Classification Criteria. Median and interquartile range are displayed in scatter dot plots.
