
Fig. 6 |. Phase-dependent neuronal coding.
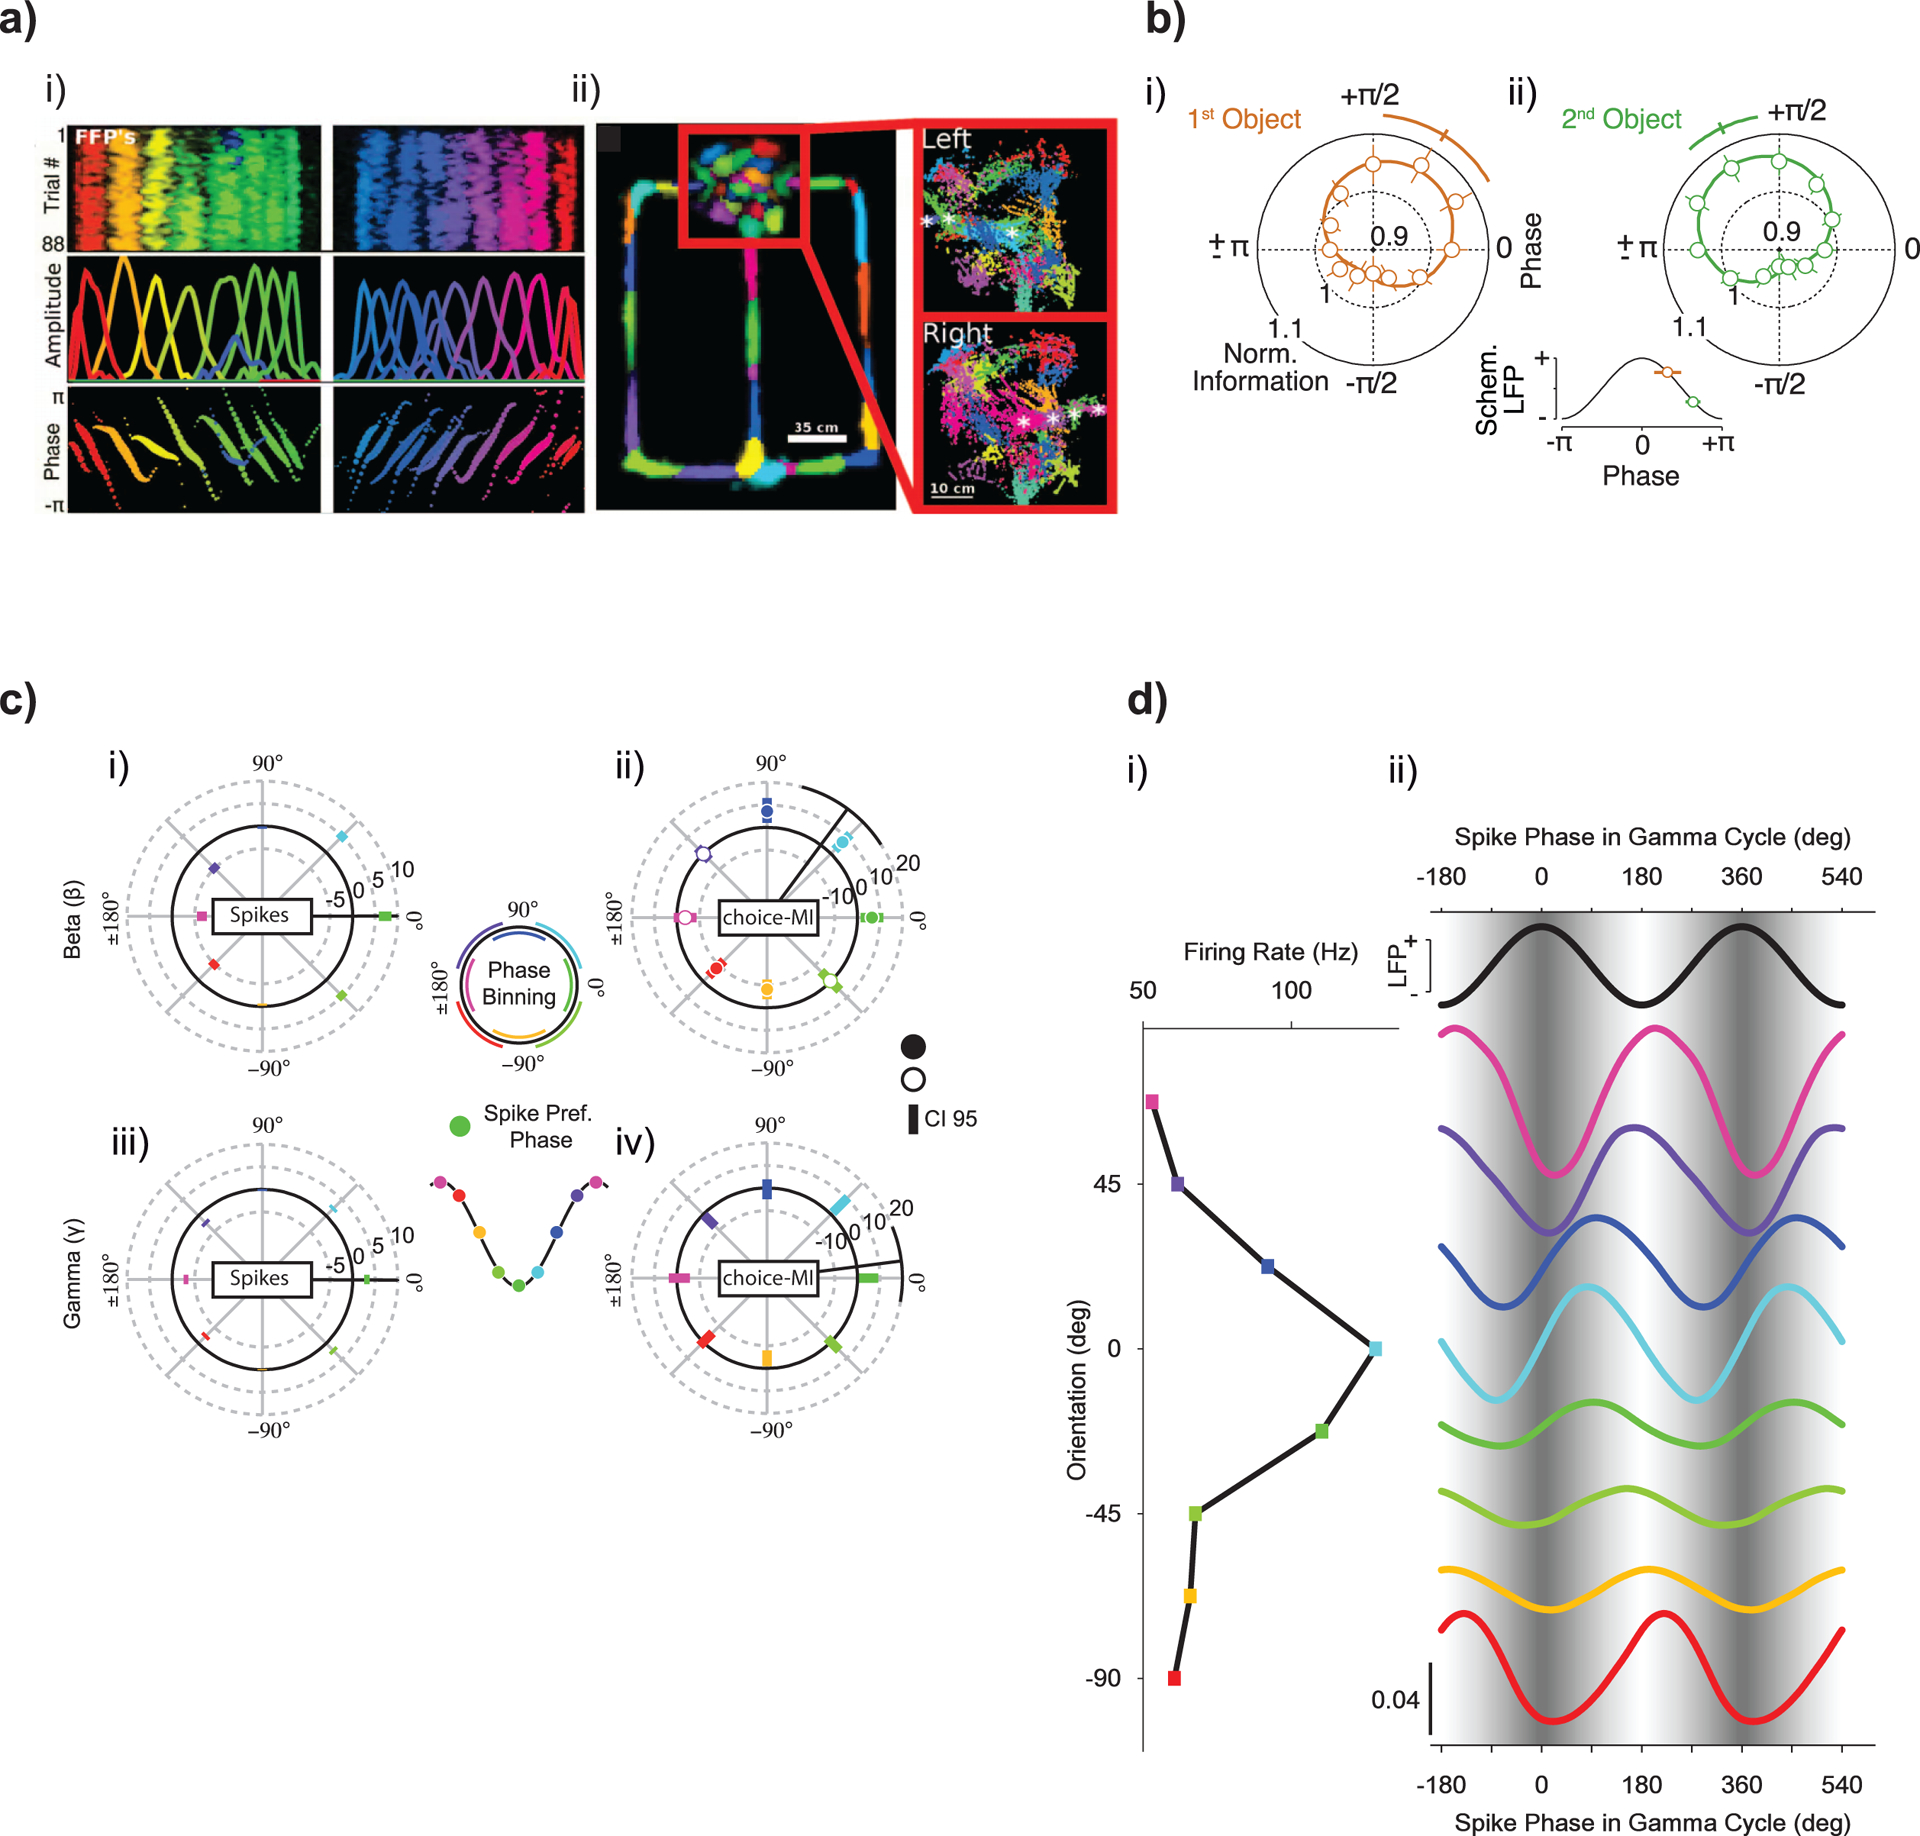
a, Place information encoded by the phase of hippocampal LFP activity. Left panels: feature-tuned field potentials (FFPs) recorded from the hippocampus during running on a linear track (top). FFPs uniformly tile the length of a linear track. The spatial extent and spacing of different FFPs is largely homogeneous across the track (middle). FFPs exhibit phase precession with respect to the first principal component of LFP activity (bottom). Place-field hues are assigned based on location of maximal activation. Right panels: activation of FFPs during running in a T-maze. Waiting area is enclosed in a red box. Far right shows close-up of activations in waiting area, separated by direction of entry. Asterisks mark activations that are entry-direction selective. Each point represents a time bin where FFP activation exceeded a threshold, its size indicating the magnitude of activation. Hues are assigned to distinguish neighbors. Image reproduced with permission from Agarwal et al.113, AAAS. b, Object information in PFC spiking during a working memory task depends on LFP phase. PFC neuron spiking encodes the identity of two sequentially presented objects during a delay interval. Spikes carry the most information about the memorized objects at specific phases of the local 32-Hz LFP. Left: optimal encoding of the first presented object is significantly earlier on the falling flank of the 32-Hz cycle. Right: encoding of the second presented object occurs later (permutation test, P = 0.007). Error bars denote s.e.m. Phase dependence induced by stimulus-locked responses was discounted. Image reproduced with permission from Siegel et al.114. c, Choice information in PPC spiking depends on beta and gamma LFP phases. Top left: average phase-dependent histogram of spike count for the beta frequency range. Coloring of the phase bins in all histograms corresponds to the schematic phase binning shown in the center. The spike-preferred phase (dark green) is depicted as a trough in the schematic to capture the tendency of spiking to occur at or near the troughs of LFP activity. The green bin at 0° corresponds to the average spike-preferred phase in the 200–1,000 ms epoch after target onset, when the choice can be made. The radial distance for each phase bin indicates the difference in spike count from random phases. Error bars depict 95% confidence intervals. The radial black line depicts the trigonometric moment of the histogram, with its 95% confidence interval indicated at the end of the line. Top right: as before but for mutual information about choice (choice-MI). Same data as before at each phase bin. Fully colored circles indicate choice-MI significantly different from the average choice-MI across all phase bins (permutation test, P < 0.05). Bottom row: as in the top row but for the gamma frequency range. Image reproduced with permission from Hawellek et al.117. d, Orientation information in V1 spiking depends on gamma LFP phases. Match between stimulus orientation and neuronal orientation preference determines spike phase in the gamma cycle. Data from one example V1 neuron. Left: firing rate as a function of stimulus orientation. Right: the black sine wave at the top and the sinusoidal gray shading in the background illustrate the LFP gamma phase. The colored lines show spike densities as a function of phase in the gamma cycle. The colors correspond to those in the panel at left. All spike density curves are probability densities, normalized such that the mean value of each curve is 1/2 (bottom left calibration bar applies to all curves, and curves are offset along the y axis to correspond to the panel at left). Reproduced with permission from Vinck et al.118, Society for Neuroscience.