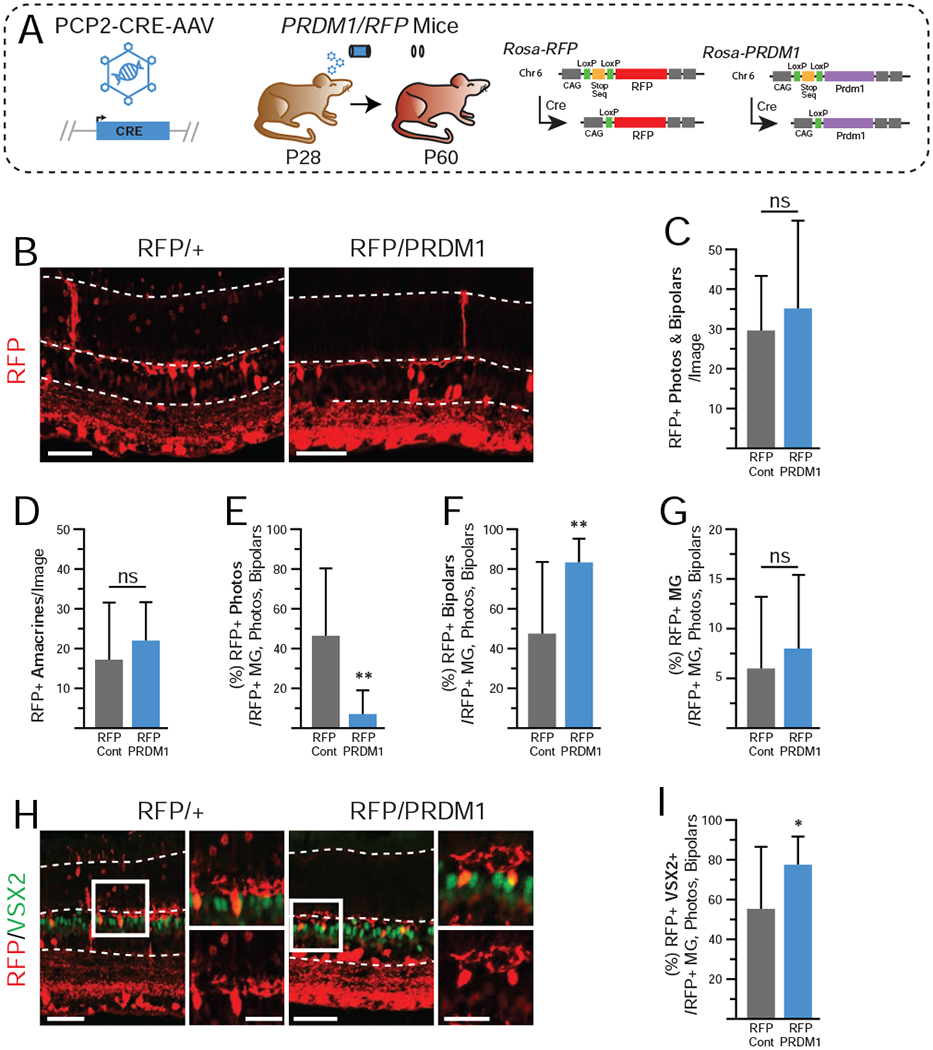
Figure 3. Overexpression of PRDM1 in mature retinas driven by PCP2-CRE-AAV.

A)Schematic of experimental design. ROSA-RFP and PRDM1 mice are as described in Figure 1. B) Representative immunohistochemistry of transduced RFP/+ controls compared to RFP/PRDM1 littermates. Arrowheads mark bipolar cells and asterisks mark photoreceptors.Note that the RFP labeling intensity of photoreceptors is less than other cell types in the retina (see also Figure S3). C-D) There is no difference in the total number of RFP+ bipolars and photoreceptors when summed, or in the total number of amacrines and ganglion cells. Amacrines and ganglion cells were excluded from the rest of the calculations. Transduced RFP/PRDM1 mice have E) a significantly lower percentage of RFP+ cells that are photoreceptors, F) an increased percentage that are bipolar cells, G) and no change in the percentage that are Muller glia compared to controls. H) There is no observable difference in VSX2 intensity (green) in RFP+ bipolars and I) there is a significantly higher fraction of RFP+ cells that co-express VSX2+ in RFP/PRDM1 mice. A total of 1,951 cells (excluding the ganglion cell layer) were quantified from 36 images. Statistics calculated based on number of eyes (N), Cont (RFP/+) N=6, RFP/PRDM1 N=11. Error bars=standard deviation. ns=not significant, *p<0.05, **p<0.01. bars=50μm, inset bars=25μm, INL=Inner Nuclear Layer, ONL=Outer Nuclear Layer.
