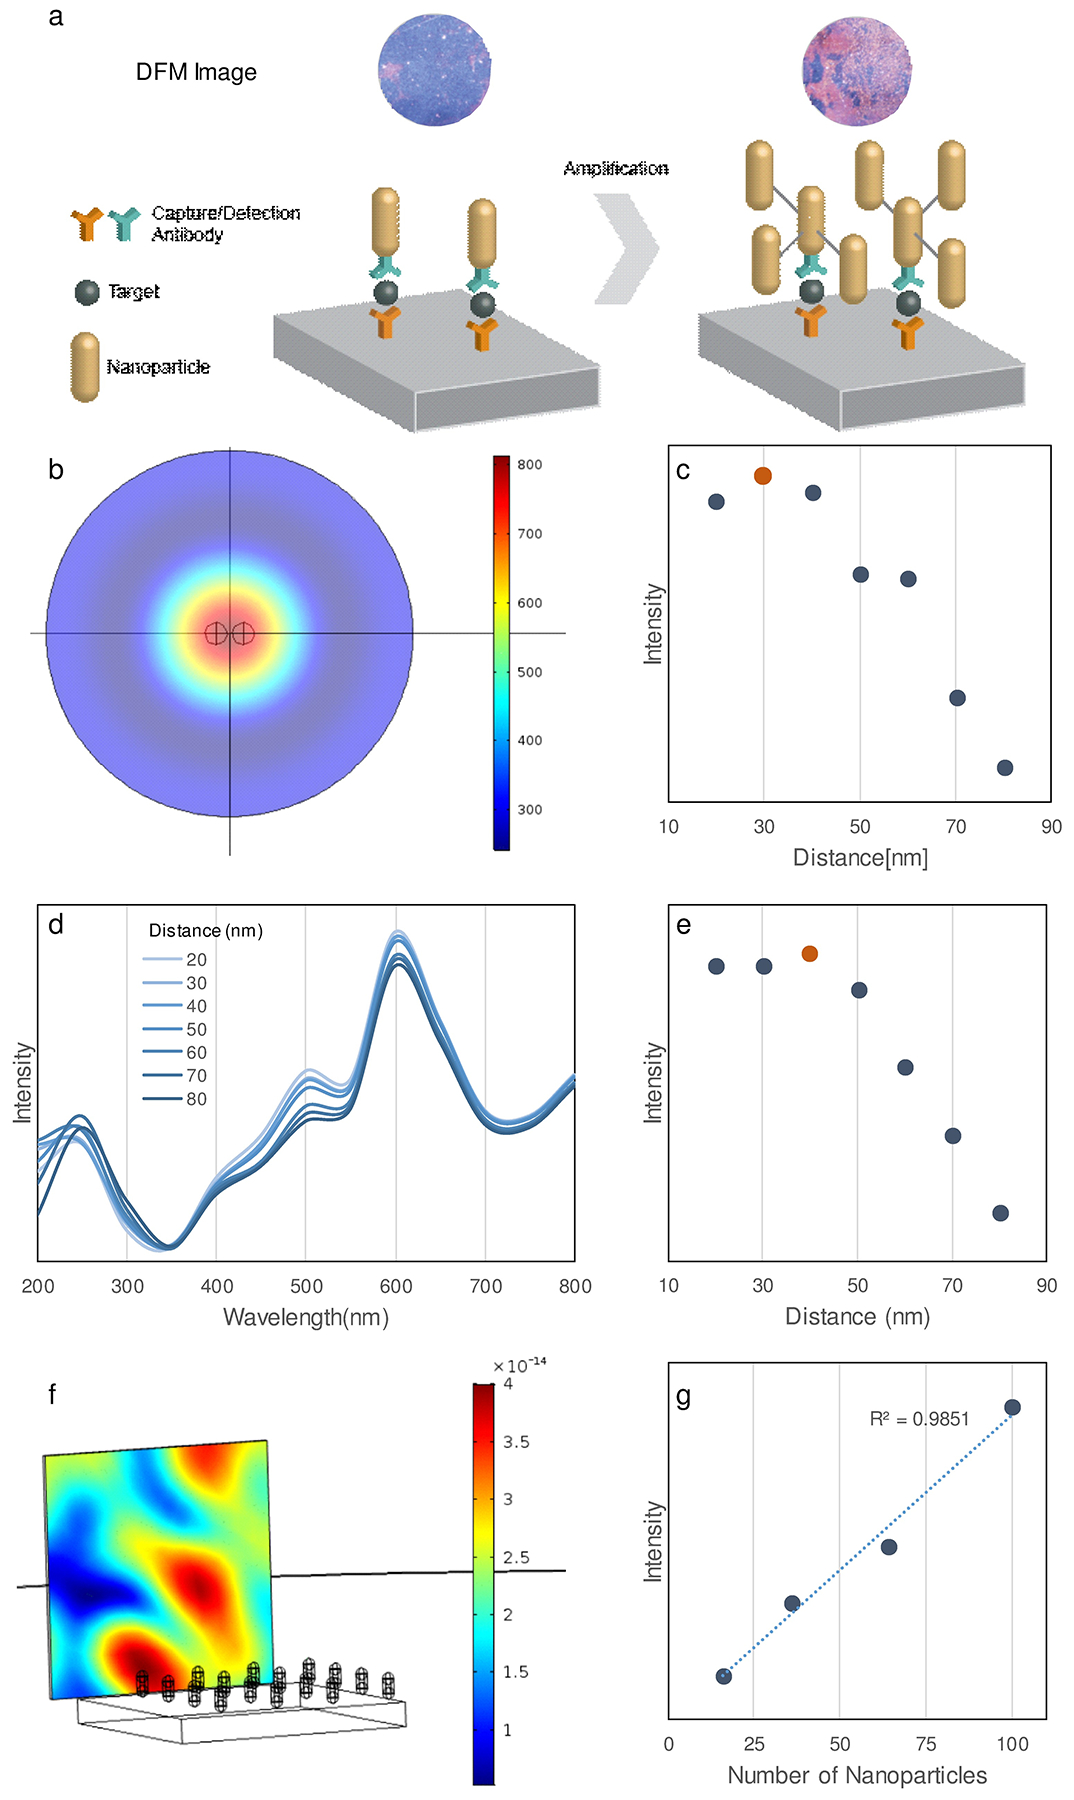
Figure 1.

Modeling and simulation. a) LMDFA amplification scheme. Simulated b) heat map and c) intensity plot of scattering intensity versus distance between AuNR pairs with 650nm incident light source. Graph of d) the scattering intensity spectrum and e) its summed intensity versus distance between AuNR pairs under broad spectrum (200–800 nm) illumination. Simulation of the scattering signal generated under 200–800 nm illumination showing the f) scatter distribution from an AuNR array (see Figure S2 for details) and g) scatter intensity versus AuNR number in this the array.
