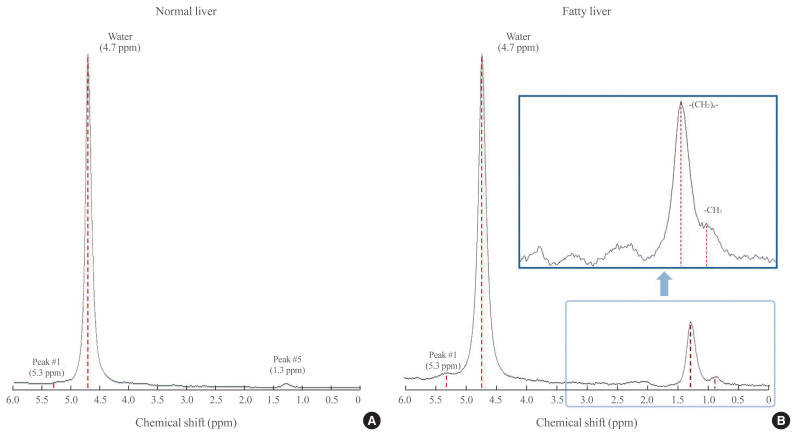
Fig. 1.
Diagrams of spectrum obtained by hepatic proton magnetic resonance spectroscopy (1H-MRS). Proton spectra obtained from normal (A) and fatty (B) livers show resonance peaks from water and triglyceride (TG), with boxes highlighting the dominant lipid peaks from the resonance of methyl (−CH3) protons and methylene (−(CH2)n−) in the TG molecule along the frequency domain. ppm, parts per million.

