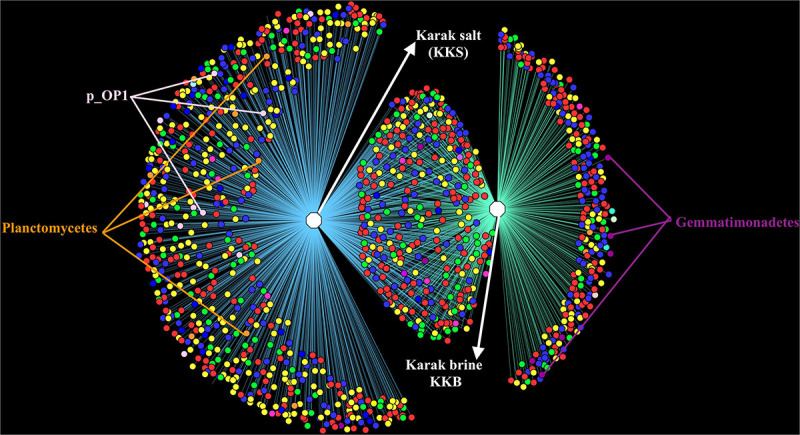
FIGURE 4.

OTU Network demonstrating the number of unique and shared OTUs in the brine and salt samples of Karak mine. The OTU table was generated using 97% cut-off sequence value and mc-10. The taxonomic clustering was displayed in the form of OTU network using the edge-weighted, spring embedded layout in Cytoscape. Node color denotes consensus taxonomy (phylum). Edges connecting OTU and sample indicate the presence of the OTU in that sample.
