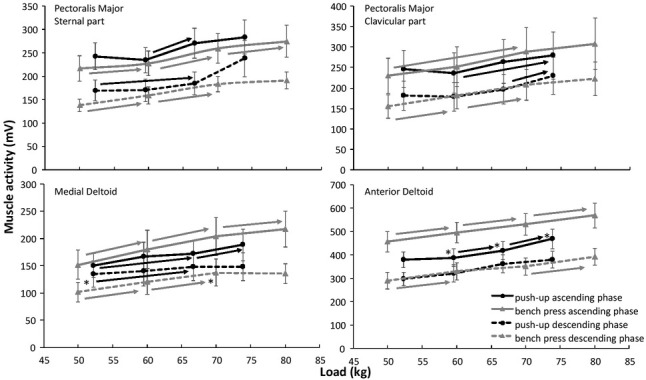
Figure 4.

Mean (± Standard error of the mean) activation of Deltoid and Pectoralis Major muscles during the descending and ascending phase at each load and exercise averaged over all participants.
* indicates a significant difference in muscle activation between the two exercises with this load at a p ≤ 0.05 level.
→ indicates a significant increase in muscle activation from this load to all right of the arrow for this exercise at a p < 0.05 level.
