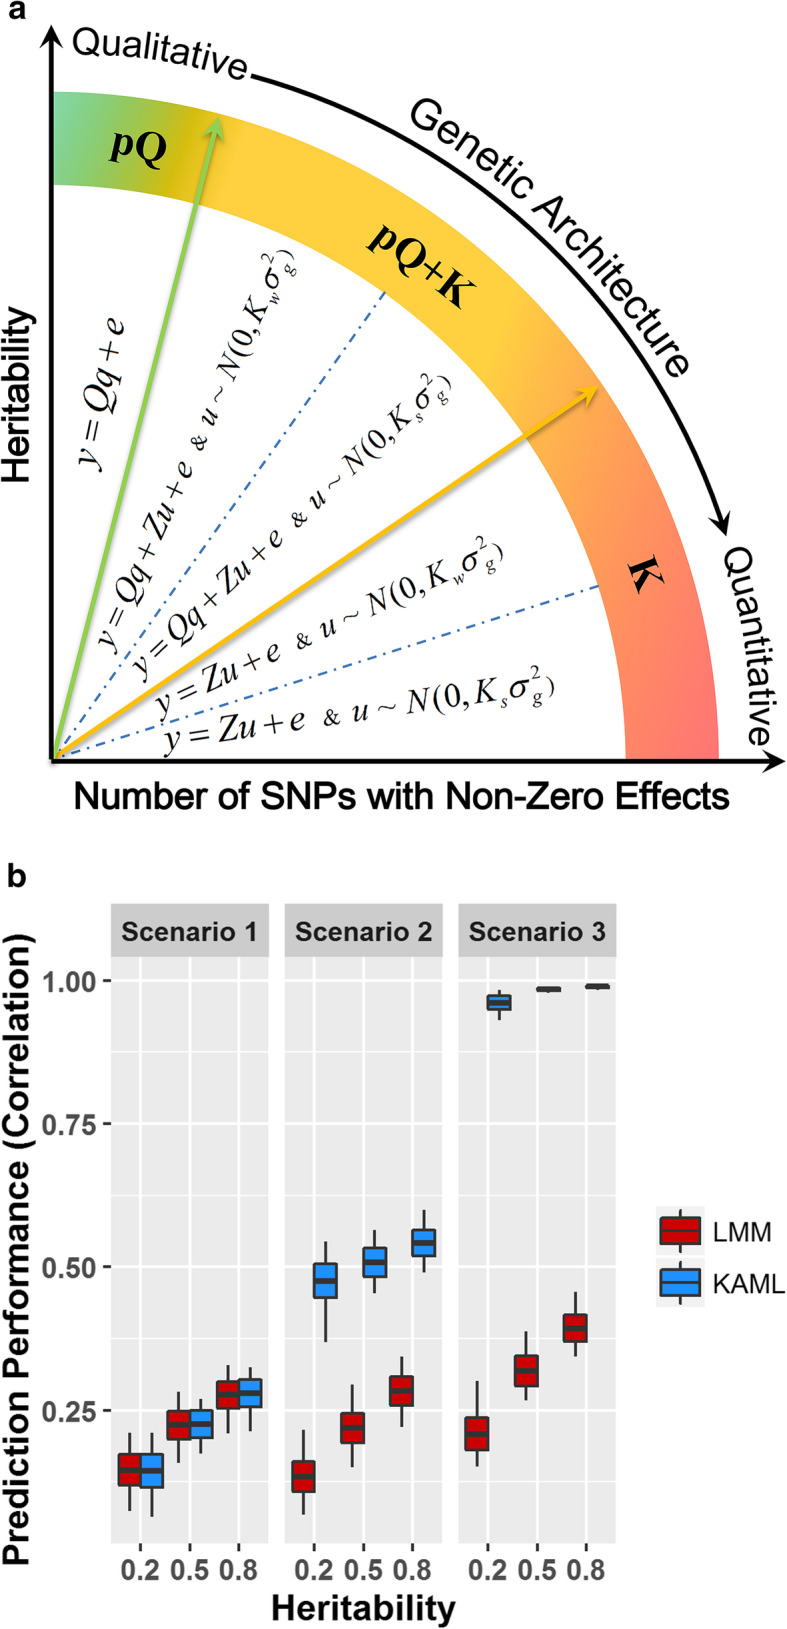
Fig. 1.

a Summary of the achieved models in KAML. Five types of models could be flexibly switched to fit the hypotheses of various types of traits underlying different genetic architectures. The pQ is the pseudo QTNs, Ks is the standard Kinship, and Kw is the SNP-weighted Kinship. b The prediction accuracy performances of LMM and KAML on simulated traits. The x-axis indexes the simulation scenarios on different levels of heritabilities. The y-axis indexes the Pearson correlation coefficients between predicted values and additive genetic effects values in the 20% randomly selected validation dataset for LMM (colored in red) and KAML (colored in blue) across 100 replicates. For each box, the middle line (colored in black) represents the average value, the bottom and top represent the standard deviation, and the top and bottom whiskers represent the maximum and minimum values, respectively
