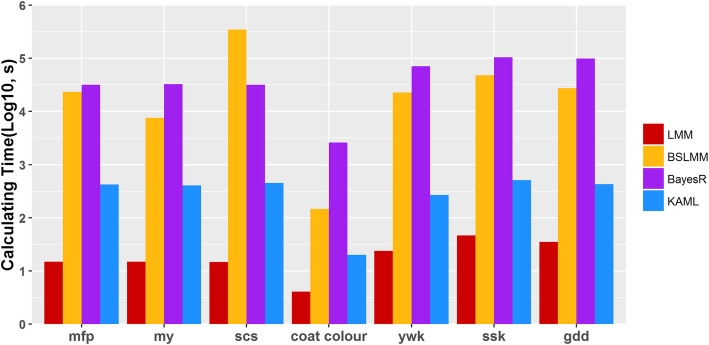
Fig. 3.
The comparison of computing performances (in seconds) of LMM (red), BSLMM (yellow), BayesR (violet), and KAML (blue) for cattle, horse, and maize datasets. The y-axis represents the computing time in log10 scale. Computing performance tests were performed in a Red Hat Enterprise Linux sever with 2.20 GHz Intel(R) Xeon(R) 132CPUs E7-8880 v4, and 2 TB memory. The computing time records are corresponding to the experiments described in Fig. 2. The computing performances of BSLMM and BayesR methods were tested using their default settings

