FIGURE 1.
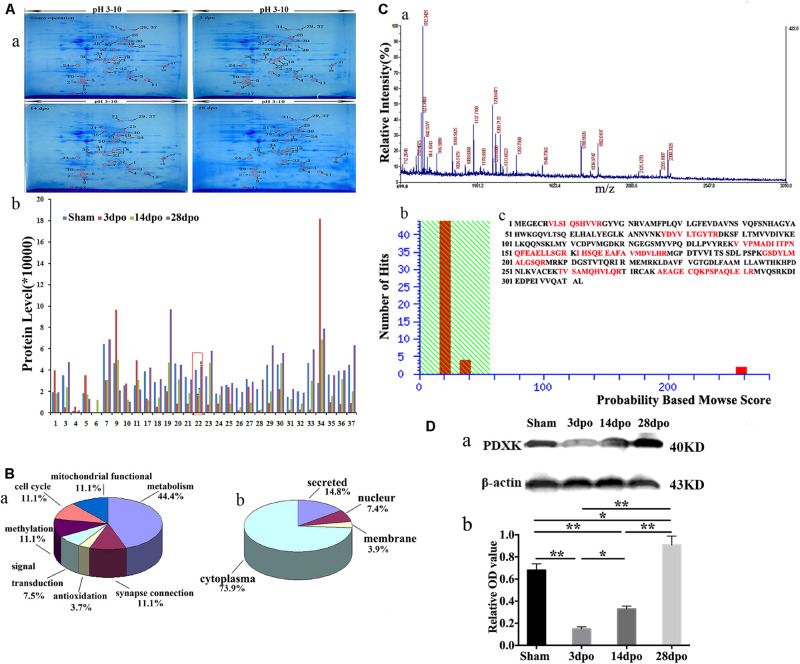
Proteomic analysis in the cortex of spinal cord transection (SCT) rats and matrix-assisted laser desorption ionization-time of flight mass spectrometry (MALDI-TOF-MS) spectrum as well as the verification of PDXK. (A-a) Representative 2-DE maps of cortex in the sham, 3, 14, and 28 dpo groups were displayed in polyacrylamide gel with CBB G-250 staining. (A-b) Protein quantitative analysis for 30 differential spots.* > 1.5-fold change vs. sham group; # > 1.5-fold change vs. 3 dpo group. (B-a,b) Classification of proteins based on their functions and subcellular localization. (C-a) Primary mass spectrometry result of spot 22 (PDXK). (C-b) The results of probability-based Mowse score showed that the differential expression of protein is PDXK, where Mowse score is 258 (>56, P < 0.05). (C-c) The amino acid sequence of PDXK and matching peptides was exhibited in bold red with 31% of matching percentage. (D-a,b) The expression level of PDXK was tested by Western blot and normalized to β-actin by Image J. Data were presented as mean ± SD. *P < 0.05; **P < 0.01. dpo, days post-operation; CBB, coomassie brilliant blue, PDXK, pyridoxal kinase.

