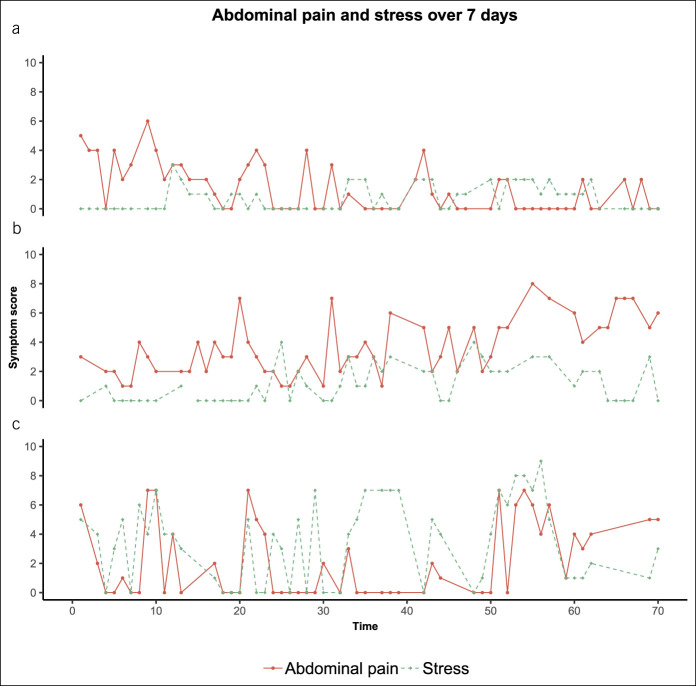
Figure 3.
Symptom severity scores for abdominal pain and stress, on 70 random time points over 7 days, separately for 3 subjects with IBS. The x axis represents the 70 consecutive assessments: each within a 90-minute timeframe between 7:30 am and 10:30 pm for each day (day 1: 1–10; day 2: 11–20; day 3: 21–30; day 4: 31–40; day 5: 41–50; day 6: 51–60; and day 7: 61–70). The heterogeneity between subjects with IBS is shown by the different patterns of stress and abdominal pain; also indicated by the difference in corresponding regression coefficients for (a) −0.23, (b) 0.07, and (c) 0.28. IBS, irritable bowel syndrome.

