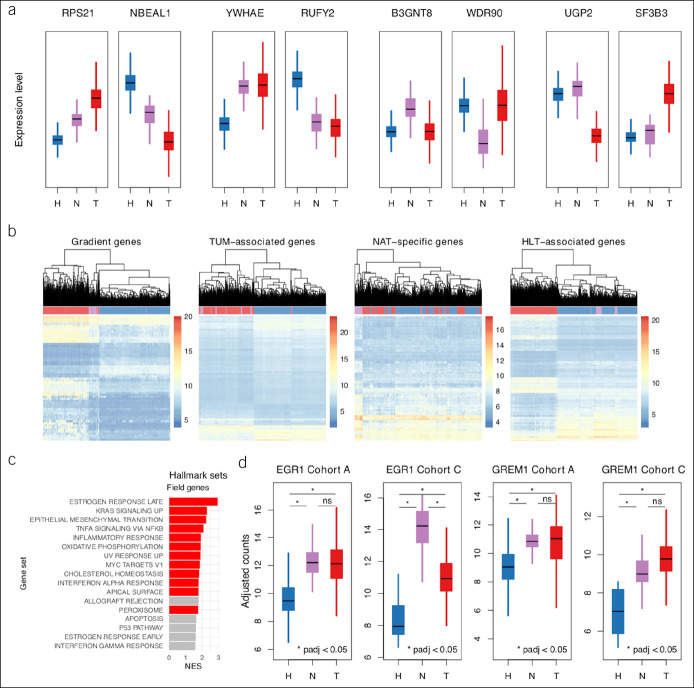
Figure 4.
Patterns in gene-level variation. (a) Box plots of batch-adjusted counts for arbitrarily selected genes representative of each of 8 DGE subpatterns aggregated into the following 4 expression patterns: gradient, TUM associated, NAT specific, and HLT associated. (b) Hierarchical clustering dendrograms and heatmaps of gene expression for all samples from cohort A. Clustering based on expression levels of all or top 500 genes from each pattern set, whichever is smaller. Heatmap gene expression levels based on batch-adjusted counts. Genes in each pattern set ordered by adjusted P value from NAT vs HLT sample comparisons. (c) Bar plot of GSEA results for overrepresentation of hallmark gene sets among gradient and TUM-associated genes using test statistics from NAT vs HLT sample comparisons for ranking; red demonstrates enrichment at FDR 5%. Only hallmark sets with absolute NES >1.5 are shown. (d) Box plots of batch-adjusted counts for EGR1 and GREM1, 2 potential drivers of tumorigenesis among field effect genes from cohort A validated in cohort C. DGE, differential gene expression; FDR, false discovery rate; GSEA, gene set enrichment analysis; HLT, healthy; NAT, normal-adjacent-to-tumor; NES, normalized enrichment score; TUM, tumor.

