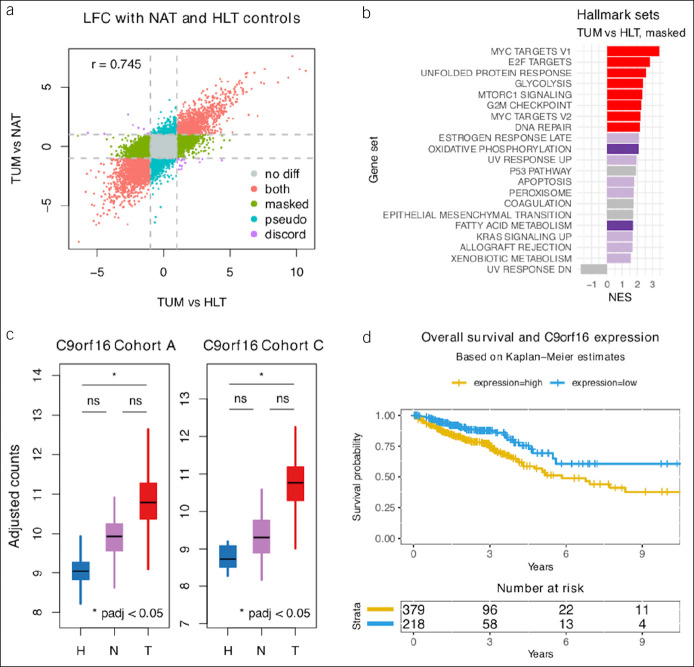
Figure 5.
Healthy controls. (a) Scatterplot of transcriptome-wide LFC between TUM and control samples, where control samples are HLT (x axis) or NAT samples (y axis). Colors indicate genes potentially masked (green), misleadingly highlighted (bluish-green), or unaffected (red) by field effect. (b) GSEA results for the 3,856 genes differentially expressed specifically between TUM and HLT and not between TUM and NAT samples; darker colors demonstrate enrichment at FDR 5% in both HLT specific and TUM vs NAT DGE results. Purple and red show discordant and concordant results, respectively. Only hallmark sets with absolute NES >1.5 are shown. (c) Box plots of batch-adjusted counts for C9orf16, 1 of 23 novel TUM-specific genes discovered in this mega-analysis. (d) Overall survival curves for C9orf16 high- and low-expression groups from previously published TCGA data downloaded from the Human Protein Atlas. FDR, false discovery rate; GSEA, gene set enrichment analysis; HLT, healthy; LFC, log2 fold change; NAT, normal-adjacent-to-tumor; NES, normalized enrichment score; TCGA, The Cancer Genome Atlas; TUM, tumor.

