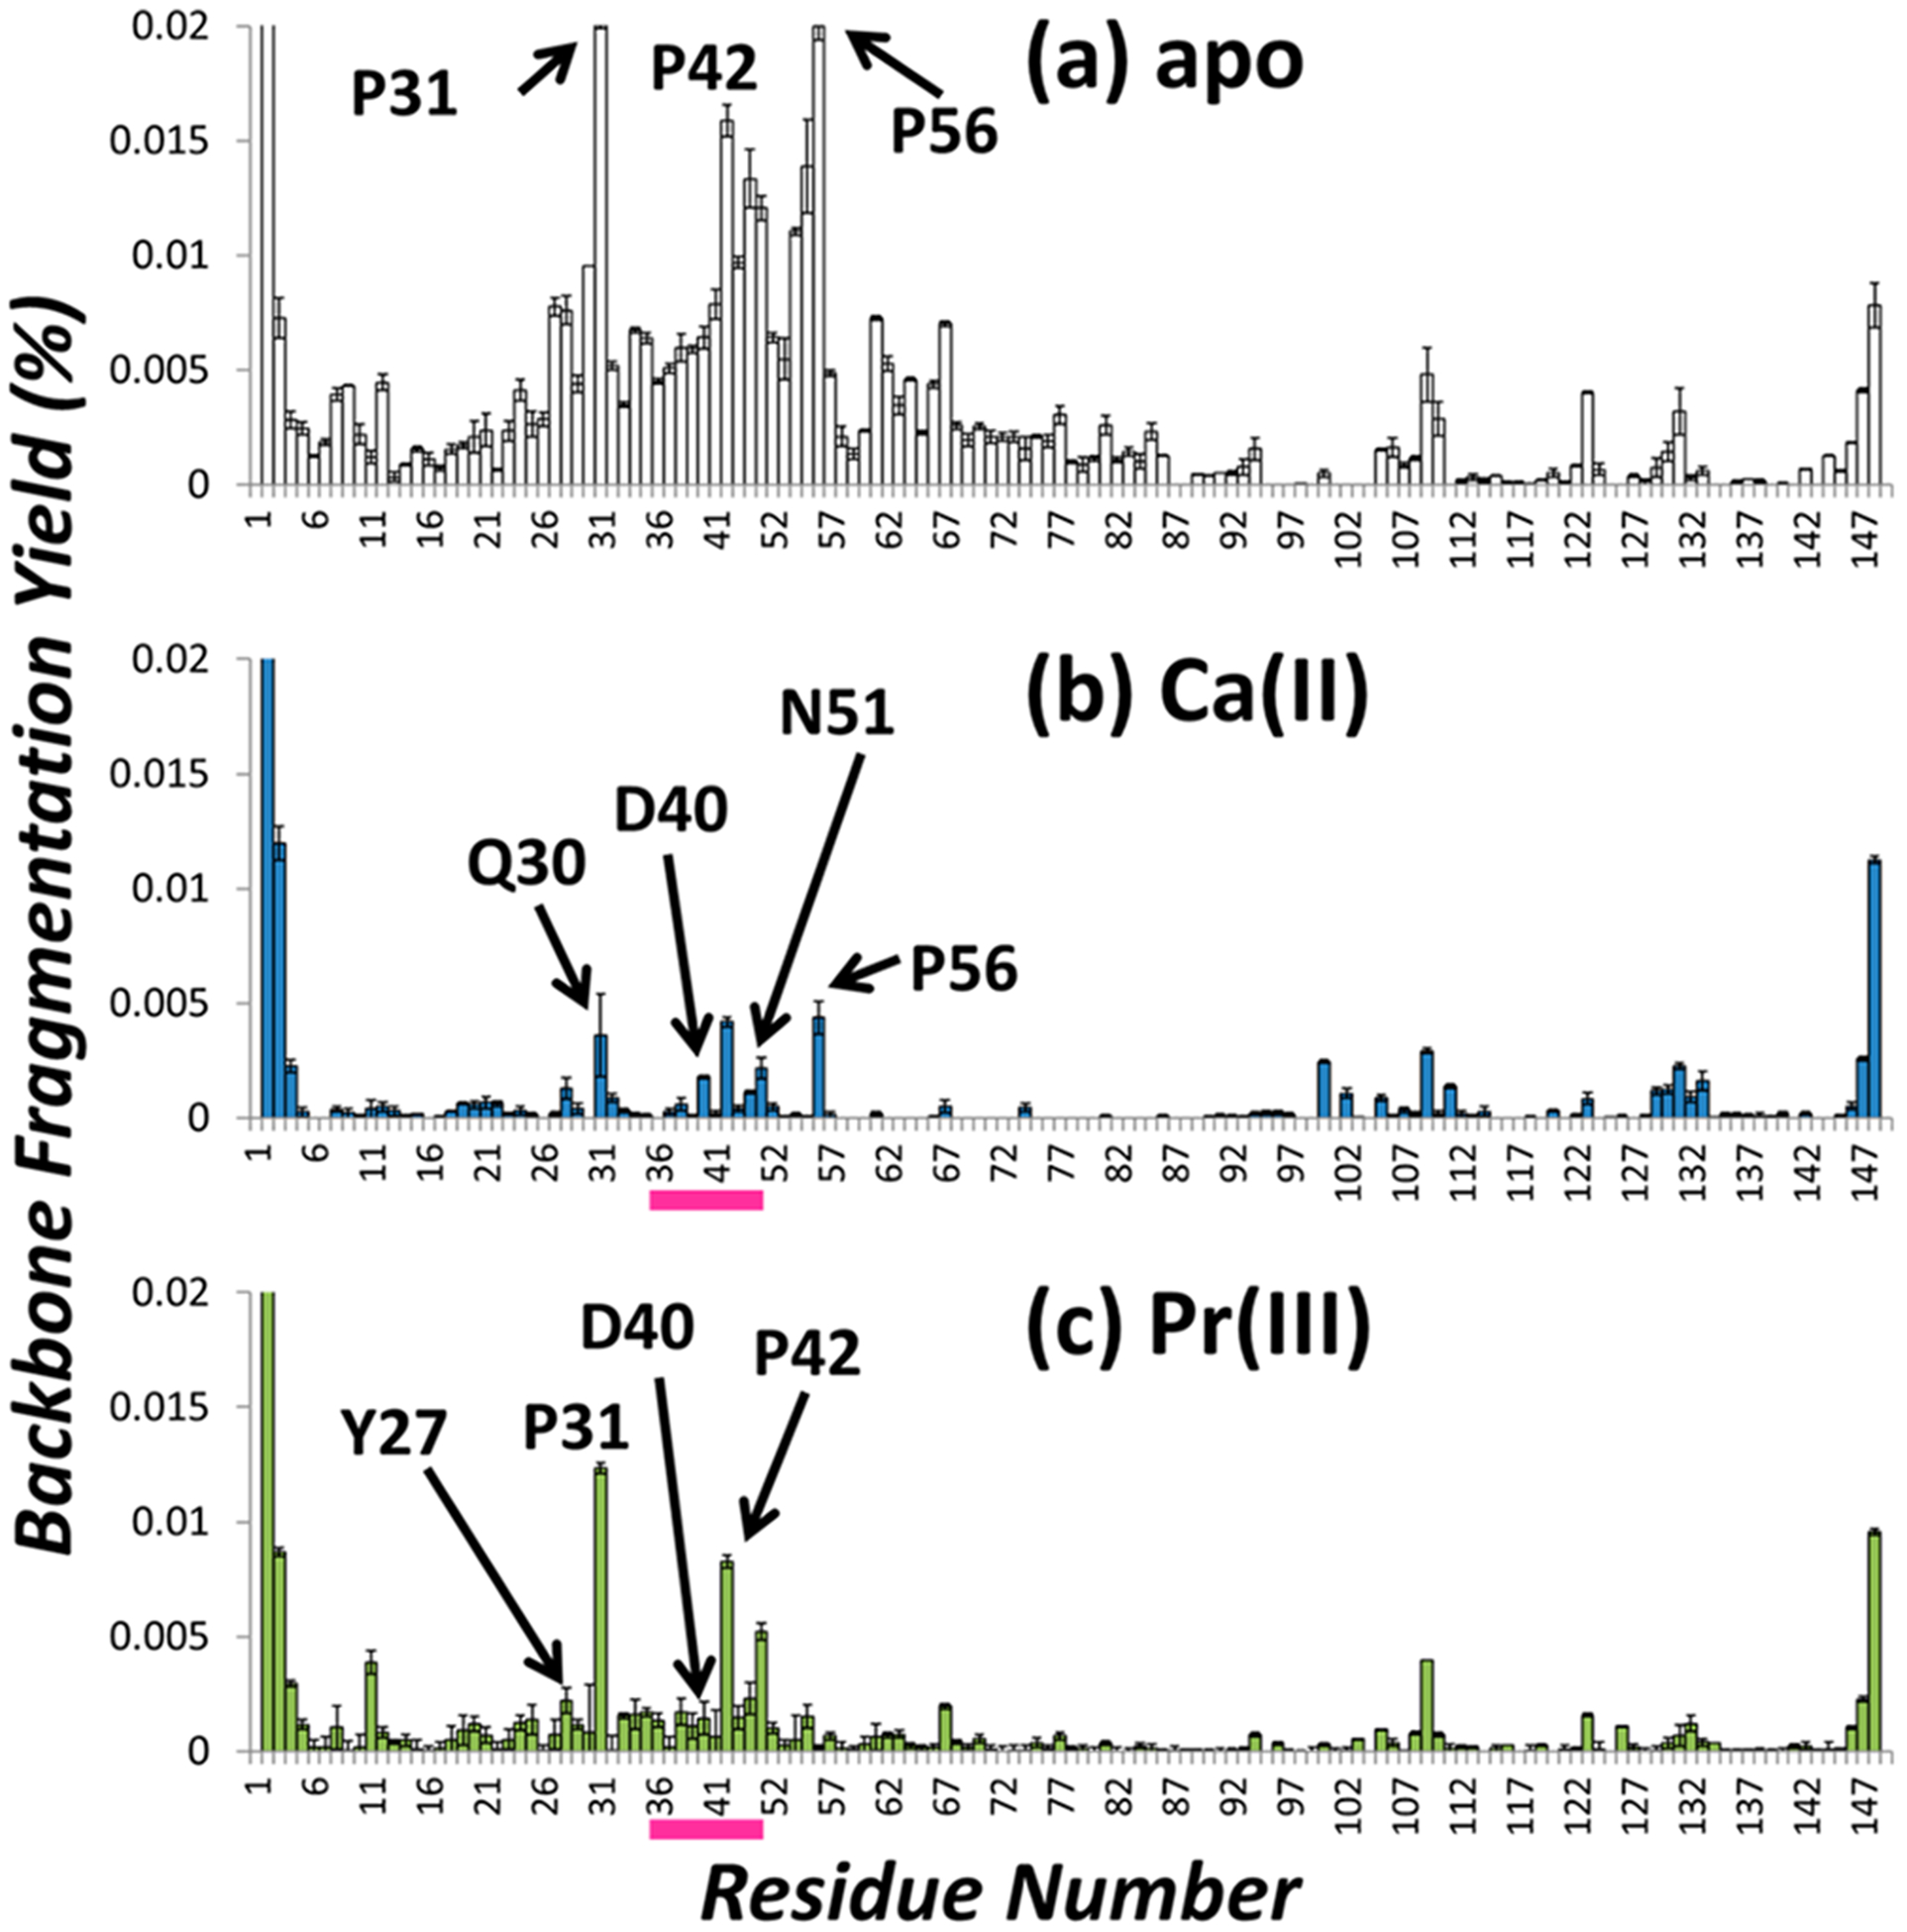
Figure 3.

Distribution of backbone cleavages from UVPD of (a) apo SNase (8+), (b) Ca(II)-bound SNase (8+), and (c) Pr(III)-bound SNase (8+), normalized to the TIC. The white bars represent apo fragment ions, and the shaded bars represent holo ions (blue for Ca(II), green for Pr(III)). Selected residues are labeled. The binding sites for Ca(II) and Pr(III) are demarcated by pink bars.
