
Figure 4.
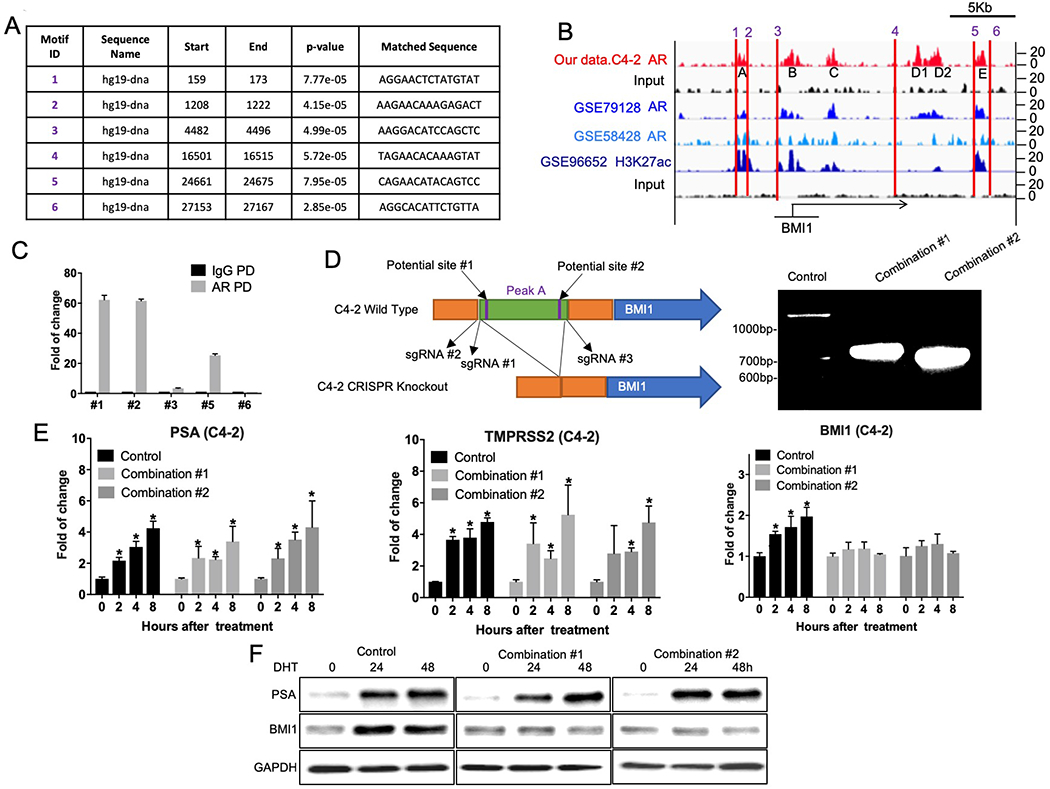
BMI1 is the direct target gene of AR. (A) MEME analysis of highly represented motifs. (B) ChIP-Seq peaks depicting AR and H3K27ac-binding profiles in BMI1 promoter (enhancer) regions. (C) ChIP-qPCR was conducted using specific primers to validate AR enrichment on BMI1 promoter (enhancer) regions. (D) Left panel: Schematic of CRISPR strategy used to cleave the targeted part of genomic DNA. Right panel: C4-2 cells were infected by lentiviral sgRNA #1 + #3 (Combination #1) or lentiviral sgRNA #2 + #3 (Combination #2) followed by puromycin selection, empty lentivirus as control. Genomic DNA were extracted, and the fragments of expected size were amplified by PCR: Control: 1992bp, Combination #1: 710bp, Combination #2: 665bp. Control and knockout cells were cultured in androgen-depleted medium and then treated with DHT. Cells were collected at indicated time points. (E) mRNA levels of PSA, TMPRSS2, and BMI1 at 0, 2, 4, or 8 h after DHT treatment were tested by QPCR. *p < 0.05 vs. 0h (normalized to 18S mRNA, mean ± SD). (F) Protein levels of PSA, TMPRSS2, and BMI1 at 0, 24, or 48 h after DHT treatment were analyzed by Western blot. All experiments were biologically repeated at least three times. Representative images are shown.